This article discusses the different options you have to install Prometheus in Kubernetes, and then explains the installation of the Prometheus operator in detail, using the kube-prometheus-stack Helm chart. I conclude with how to upgrade your Prometheus stack as well as your own alerting rules and Grafana dashboards.
Kubernetes observability article series
This article is part of a series of blog posts about Kubernetes observability. You can find all other articles of the series here!
Introduction
The Prometheus stack is a popular set of tools used to achieve observability of your system. As I explained in the learning guide outlined in part I of this Observability article series, the Prometheus stack could be used on individual servers (e.g. with Docker), but is designed to monitor large-scale distributed systems. The Prometheus stack shines when using it in Kubernetes, for several reasons:
- Prometheus comes with dynamic service discovery (SD) for Kubernetes: in the
scrape_configsection of the Prometheus configuration file you can add a target of type kubernetes_sd_config, which instructs Prometheus to contact the Kubernetes API server to discover available nodes, pods, services, etc., and to scrape metrics from them. - Many components of Kubernetes (e.g. the API server) already export metrics, in the Prometheus metrics format
- A large ecosystem (kube-prometheus) has formed to further improve the integration of Kubernetes and Prometheus (and related components, such as Alertmanager, Grafana, etc.)
Required knowledge
To make the most of this article, you need to be familiar with Prometheus and Kubernetes:
Regarding Prometheus: you first need to understand Prometheus well, including its architecture, concepts, how to configure it, and the PromQL language, for which you can consult my other articles (see above).
Regarding Kubernetes: you should be familiar with basic concepts, including Helm charts and Kubernetes operators.
In this article I’ll discuss the different installation options, explain the installation of the Prometheus operator in detail, and conclude with how to upgrade your Prometheus stack, alerting rules and Grafana dashboards.
Prometheus installation options for Kubernetes
To get Prometheus up and running in Kubernetes, you have three options:
- Install only Prometheus (and a few related components, such as Alertmanager, but not Grafana) using the Prometheus Helm chart. Configuration is done using the Prometheus-native files (such as
prometheus.yml, oralert-rules.yml). - Install the Prometheus Operator using its Helm chart, without any CRs: this installation approach is not recommended, because this way of installing it is now deprecated, use option 3 instead. The Prometheus operator (which, by itself, is not at all deprecated) is a Kubernetes operator that lets you handle the provisioning and operating various components (such as Prometheus and Alertmanager) using CRDs (documented here). In other words: configuration is done using Kubernetes-native objects, instead of Prometheus-native files. The Prometheus operator converts them to the Alertmanager/Prometheus-native configuration format on the fly.
- Install the Prometheus Operator along with Grafana and many default alerting rules and dashboards, using the kube-prometheus package. kube-prometheus is a GitHub project that contains a huge library of best-practices and instructions for how to install the Prometheus operator, including many sensible default configurations.
Option 3 is the recommended approach, the next section presents more details.
In summary (showing only options 1 & 3):
| Prometheus Helm chart | kube-prometheus-based Prometheus operator | |
|---|---|---|
| Configuration type | Prometheus-native | Kubernetes-native |
| Installed default components | Prometheus Alertmanager Node exporter kube-state-metrics | See option 1 + Grafana |
| Comes with pre-installed library of alerting rules and dashboards | ❌ | ✅ |
If you are unclear about the projects kube-state-metrics, prometheus-adapter and metrics-server and how they relate to Prometheus, expand the below box.
Detailed look at the Prometheus operator
Using the Prometheus operator (from the kube-prometheus package) is the recommended approach to install and operate Prometheus in Kubernetes. It will require you to learn about new concepts that are specific to the operator, but the advantage is that the operator simplifies many tasks. As the official GitHub repo states:
- Simplified Deployment Configuration: Configure the fundamentals of Prometheus like versions, persistence, retention policies, and replicas from a native Kubernetes resource.
- Prometheus Target Configuration: Automatically generate monitoring target configurations based on familiar Kubernetes label queries; no need to learn a Prometheus specific configuration language.
The last sentence, “no need to learn a Prometheus specific configuration language“, is just marketing BS. You do need to be familiar with most concepts of Prometheus and Alertmanager, as you would otherwise not be able to debug problems. Also, some aspects of the configuration require you to literally write YAML sections that would normally be part of a prometheus.yaml, alertmanager.yaml or alert-rules.yaml file.
In the following subsections we will look at central concepts of the Prometheus operator, how to install it into your cluster, how to configure monitoring of additional services, and how to get custom dashboards into Grafana.
Central concepts of the Prometheus operator
Like any typical Kubernetes operator, the Prometheus operator scans your cluster for new or changed CRs (Custom Resources), and then deploys additional pods or adapts configurations in accordance to these CRs. The most relevant CRDs are:
Prometheus: defines a Prometheus deployment (which the operator will deploy asStatefulSet). It provides options to configure replication (HA mode), persistent storage, and Alertmanagers to which the deployed Prometheus instances send alerts.Alertmanager: defines a Alertmanager deployment (which the operator will deploy asStatefulSet). It provides options to configure replication (HA mode) and persistent storage.ServiceMonitor: specifies Kubernetes services that should be scraped by Prometheus. The Prometheus operator automatically generates scrape configurations for them and configures the Prometheus instances to use them.PodMonitor: likeServiceMonitor, but for Kubernetes pods.PrometheusRule: defines Prometheus alerting and/or recording rules. The Operator generates a rule file, and configures the Prometheus instances to use it.AlertmanagerConfig: specifies subsections of the Alertmanager configuration, allowing routing of alerts to custom receivers, and setting inhibit rules.
There are a few more CRDs you only need in certain instances. You can find the exhaustive, detailed description of the CRDs in the operator’s design docs (definitely a recommended reading).
Installation of the operator
Installing the kube-prometheus package can be done in two ways: using jsonnet (see official instructions), or using a Helm chart called kube-prometheus-stack. I will discuss the Helm chart option in detail, because most people are familiar with Helm already. While the Jsonnet approach may be more flexible than the Helm chart, it requires that you take the time to learn jsonnet and the surrounding tools. I’ve found the jsonnet syntax to be as incomprehensible as Objective-C, so that was a natural impediment for me to learn it.
To install kube-prometheus-stack, first add the Helm chart’s repository, as instructed here. Create a custom-values.yaml file in which you customize many different details (see below). Finally, assuming that your kube config is set up correctly (using the right context for the right cluster), run helm upgrade --install -f custom-values.yaml [RELEASE_NAME] -n monitoring --create-namespace prometheus-community/kube-prometheus-stack to install (or upgrade) it.
As with any Helm chart, you will need to study how it works by looking at the chart.yaml and values.yaml file, so that you override the options that make sense for you in your custom-values.yaml file. Here are a few pointers I found helpful:
- In the kube-prometheus-stack
values.yamlfile, the configuration options below the keys “grafana“, “kubeStateMetrics” and “nodeExporter” are not well-documented, because these are sub-charts defined in theChart.yamlfile. TheChart.yamlfile points to the GitHub repos where these respective charts are found, so refer to them to learn how these options work. - The chart creates a large number of alerting rules (see
defaultRules), but does not create a default Alertmanager configuration (that dictates which receivers there are and how alerts are routed to receivers). You still need to provide your own Alertmanager configuration, by either creating a yaml file that contains aAlertmanagerConfigCR (see the respective section in the operator’s design docs), or by providing the configuration in thecustom-values.yamlfile in sectionalertmanager.config. - In the
values.yamlfile, search for configuration options starting with “additional…” to learn which custom options you can set in the Helm chart. Interesting findings (IMO) are:additionalPrometheusRulesMapprometheus.prometheusSpec.additionalScrapeConfigs
prometheus.prometheusSpec.additionalAlertManagerConfigs- From the names of these options (and the inline documentation) it should be quite obvious how to use them.
- You should tweak the persistent storage used by Prometheus and Alertmanager. While a few GBs of storage will be sufficient for Alertmanager (which does not store much data), things become more complex for Prometheus, because storage requirements depend on the retention period and the amount of scraped samples (per time unit), which is different for every system. See here for pointers. Regarding Grafana: the kube-prometheus-stack Helm chart treats Grafana as a stateless component on purpose, even though it is usually operated statefully, e.g. to store users or dashboards. The reason is that all configuration data should be stored in (plain-text) files. This is the default for Prometheus and Alertmanager already, and the Helm chart enforces this to Grafana, too, by not setting
grafana.persistence.enabledtotrue(which isfalseby default, see here).- For Alertmanager, tweak the options
alertmanager.alertmanagerSpec.retentionandalertmanager.alertmanagerSpec.storage - For Prometheus, tweak the options
prometheus.prometheusSpec.retentionandprometheus.prometheusSpec.storageSpec
- For Alertmanager, tweak the options
- Limiting the resource requests and limits is always a good idea, especially for Kubernetes clusters with pre-defined resource quotas. Set
prometheus.prometheusSpec.resources,alertmanager.alertmanagerSpec.resources,grafana.resources,grafana.sidecar.resources,nodeExporter.resources, andkubeStateMetrics.resources. - Fully automatic High availability of Prometheus is still on the roadmap for the Prometheus operator team (see here for details). They key concept to scale Prometheus is sharding and federation. For now, you can either do sharding yourself (limiting each
PrometheusCR to scrape only certain targets, e.g. using theserviceMonitorSelectoroption), or (additionally) use theshardsfeature of the kube-prometheus-stack Helm chart, but be aware of the complexities that this involves. - Set
prometheus.prometheusSpec.serviceMonitorSelectorNilUsesHelmValuestofalse. Otherwise, the Prometheus operator would only detect thoseServiceMonitorCRs which were installed as part of the kube-prometheus-stack Helm chart (having the “release: [RELEASE NAME]” label), and would not detect other ServiceMonitor CRs from other sources, having different labels. Presumably, the default value (true) was chosen to limit the resource usage of the Prometheus installation. - Set
grafana.sidecar.datasources.searchNamespacetoALL, so that Grafana will pick upConfigMapscontaining dashboards in every namespace. Otherwise (as default behavior) Grafana only detectsConfigMapslocated in the same namespace as Grafana itself. See below for more details about Grafana dashboards.
Configuring ServiceMonitors
As explained above, ServiceMonitor CRs tell Prometheus to scrape specific Kubernetes services, based on label selectors. Apart from the design docs, the API definition is a valuable resource to learn more about the ServiceMonitor CRD.
By default, a ServiceMonitor CR must be in the same Kubernetes namespace as the Endpoints of the Service it refers to, unless you define .spec.namespaceSelector.any = true in the CR.
It generally makes sense to examine which pre-existing services there are in your cluster, which are not directly related to your application, and create ServiceMonitor CRs for them. Typical examples include the Ingress controller or a GitOps controller, such as ArgoCD.
Here is a ServiceMonitor example for the Traefik Ingress controller:
apiVersion: monitoring.coreos.com/v1
kind: ServiceMonitor
metadata:
  name: traefik-monitor
  labels:
    app: traefik
spec:
  selector:
    matchLabels:
      app: traefik
  endpoints:
  - port: metricsCode language: YAML (yaml)
Setting up Grafana dashboards
To get custom dashboards into Grafana, the kube-prometheus-stack uses ConfigMaps. The mechanism behind this is a side-car container for Grafana. In values.yaml, grafana.sidecar is enabled by default. This causes the installation of the k8s-sidecar container in the Grafana Pod, which continuously looks for ConfigMaps with a label such as “grafana_dashboard: '1'“. These ConfigMaps need to contain the dashboard json as data value. Upon detection, k8s-sidecar mounts that json as file into the Grafana container, causing Grafana’s provisioning mechanism to pick it up.
To get a dashboard into the cluster, follow these steps:
- First you need a dashboard in json form (e.g. this one). Often, you get this dashboard by interactively building it in Grafana’s web UI, and then exporting it as file (docs).
- Convert the JSON file to a
ConfigMap, e.g. viakubectl create cm config-map-name --from-file dashboard.json -o yaml --dry-run > config-map.yaml - Edit
config-map.yamlwith a text editor: add the labelgrafana_dashboardwith value"1" - Apply the config map to your cluster (
kubectl apply -f config-map.yaml -n <namespace>) - If Grafana did not pick up the dashboard automatically, you may have to restart Grafana.
Installing and scraping additional exporters
Getting a service (e.g. a database, message broker, etc.) monitored in Kubernetes always involves these steps:
- Choose and deploy a suitable exporter (using Kubernetes mechanisms, such as a
Deployment), unless that service already comes with a built-in/metricsendpoint, - Write a
ServiceMonitorthat instructs Prometheus to scrape that exporter, - Write alerting rules for that exporter.
Fortunately, many Helm charts of common services already have options that do all of these steps for you. An example is the Bitnami Postgres Helm chart, where setting metrics.enabled, metrics.serviceMonitor.enabled and prometheusRule.enabled to true will take care of everything.
For many other common exporters (such as Blackbox exporter, redis, rabbitmq, or Pushgateway) you can find supported Helm charts here.
About Prometheus target labels
In this article I explained the concept of instrumentation vs. target labels. Target labels are attached by Prometheus at the time of scraping. When using Prometheus outside of Kubernetes, Prometheus automatically adds the target labels job="..." and instance="...".
However, when running Prometheus in Kubernetes, several other labels are added, as the screen shot below illustrates, which I took of the Prometheus web UI (Status -> Targets):
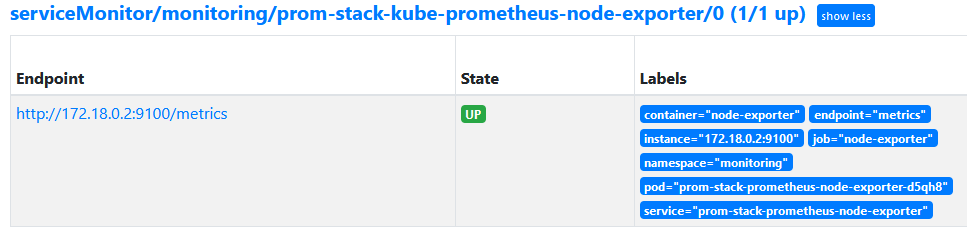
container and namespaceIf you want to add more (static) target labels to all metrics scraped from a Service for which set up a ServiceMonitor, you have two options:
- Update both the
ServiceandServiceMonitor: you add your static label (somekey: somevalue) under themetadata.labelsof yourService. In yourServiceMonitor, add the label key to.spec.targetLabels, which is an array. See here for an example. - Update only the
ServiceMonitor, using the Prometheus relabeling feature, e.g. as demonstrated here. Notes:- The original post is looking for help, claiming that their
relabelingsexample does not work. It did work just fine in my experiments. - Prometheus does not actually replace the source label. In the linked example, the source labels,
[__name__], will not be deleted. Instead, Prometheus actually just adds yourtargetLabel. I am not sure what Prometheus folks were thinking when making up the naming of their YAML syntax…
- The original post is looking for help, claiming that their
Upgrading your monitoring stack
Most tutorials forget (?) to mention that just running the helm install command once (from your developer laptop) is a bad idea. You should update your monitoring stack from time to time, in an automated fashion. Tools such as dependabot or Renovate bot are a great help, in combination with configuration management as code tools, such as Helmfile or Helmsman. You can find a detailed introduction to Renovate bot in my previous article here. Use these bots to regularly check for new kube-prometheus-stack Helm chart releases, and have them automatically apply minor version updates of the Helm chart to your cluster / Git repository.
Whenever there is a new major release of the chart, however, you should avoid fully-automated updates. Instead, have the bot create a Merge/Pull Request (to notify you), followed by manually checking the Helm chart upgrade section for potential caveats first.
Check out this article I wrote to learn how you can implement auto-upgrades of your monitoring stack using GitOps.
Updating alerting rules and dashboards
Whenever you tweaked the files that contain your alerting rules (or Grafana dashboards), you need a mechanism that automatically deploys them to your cluster:
- Updating alerting rules:
- Option 1 – push (with Helm): if you provided all your alerting rules in the
custom-values.yamlfile (inadditionalPrometheusRulesMap), then commit them to Git and build a job in your CI/CD pipeline which re-runs thehelm upgradecommand for the kube-prometheus-stack Helm chart (this is the “CI Ops” approach). - Option 2 – pull (with GitOps): as described in my previous article, you can run a GitOps operator (ArgoCD, etc.) which regularly pulls changes from your Git repository. Put your alerting rules into yaml file(s), as
PrometheusRuleCRs (with file contents similar to what the kube-prometheus-stack Helm chart would create, see here) and store them in Git.
- Option 1 – push (with Helm): if you provided all your alerting rules in the
- Updating dashboards: this works exactly like updating alerting rules. The only difference is that you cannot specify additional dashboards in the
custom-values.yamlfile directly. You have to either push dashboard config yaml files in a CI/CD job (usingkubectl apply -f ...commands), or use the GitOps approach as described above in Option 2.
Conclusion
Getting an entire Prometheus stack up and running in a Kubernetes cluster does take some time at first. You have to get used to the Prometheus operator concepts instead of manually writing configuration files. On the bright side, the Prometheus operator, in combination with the templates offered by the kube-prometheus project, takes a lot of work off your shoulders.
In case you run into problems, I recommend two things:
- Look at the Prometheus operator documentation files on GitHub,
- Understand how the kube-prometheus-stack Helm chart has configured the default values, by looking at the CRs (
Prometheus,Alertmanager, etc.) that it created in your cluster.
What are your thoughts on https://github.com/prometheus-operator/kube-prometheus/discussions/1509
which seems to be saying, in so many words, that the jsonnet build approach is better than the helm charts?
Hi Mark. I read this. First, there aren’t many words (compared to the length of my articles) :D. Second, it does not really say that the Jsonnet-approach is so much better, but that it is more flexible. I agree to that sentiment, and also mentioned it in my article, see the sentence: