This article explains best practices for writing alerts on an abstract, tool-independent level. I go into technical alerting patterns (including RED and USE) and why it is better to start from a business angle instead. I elaborate on general alerting rule design, such as alert frequency and appropriate destinations, and give concrete tips for addressing observability in the different layers of your application, e.g. servers vs. services vs. applications. I also explain the basic idea of incident management, and how testing observability in production environments achieves the highest possible level of observability.
Kubernetes observability article series
This article is part of a series of blog posts about Kubernetes observability. You can find all other articles of the series here!
Introduction
The Prometheus stack is a popular set of tools used to achieve observability of your system. As indicated in the learning guide outlined in part I of this Observability article series, there are many technical things to learn, which I covered in the Technical track. But there is also meta-level knowledge you need to acquire, which is tool-independent, which I put into the High-level observability track. One of the concrete meta-level knowledge items is to learn high-level alert design principles – principles that people working in this field gathered over time, which we are gonna look more closely in this article.
The goal of this article is to help you get started with writing your first alerting rules that give you the most benefit. Without such guidance, having only lots of technical knowledge would not be helpful. There are too many metrics data sources you could create alerts for. Chances are that you would produce a very noisy stream of alerts, which get dismissed.
Many of the points covered here are from the book Practical monitoring (published 2017), which I definitely recommend you read more closely. The given advise may be more than four years old, but almost all of it still applies today.
Technical vs. business-driven alerting
If you are an engineer, chances are that you approaching the problem with a technology angle, because that is what you are good at and what you know about. You would probably start analyzing which infrastructure / servers you have, which services they run (e.g. databases, etc.), how networking comes into play, and what technical issues your application might have (e.g. memory consumption, garbage collection, etc.).
Two widely applied technical alerting patterns are RED and USE presented below:
However, a much better approach is to tackle the problem from your end-user’s perspective. After all, you are building software for end-users, and if they leave because your application is not working (well), you’d be out of business. Your end-users have no idea about the servers or services that power your application. They only interact with some kind of user interface, thus you better start building metrics (with corresponding alerts) that indicate when something is wrong with that interface.
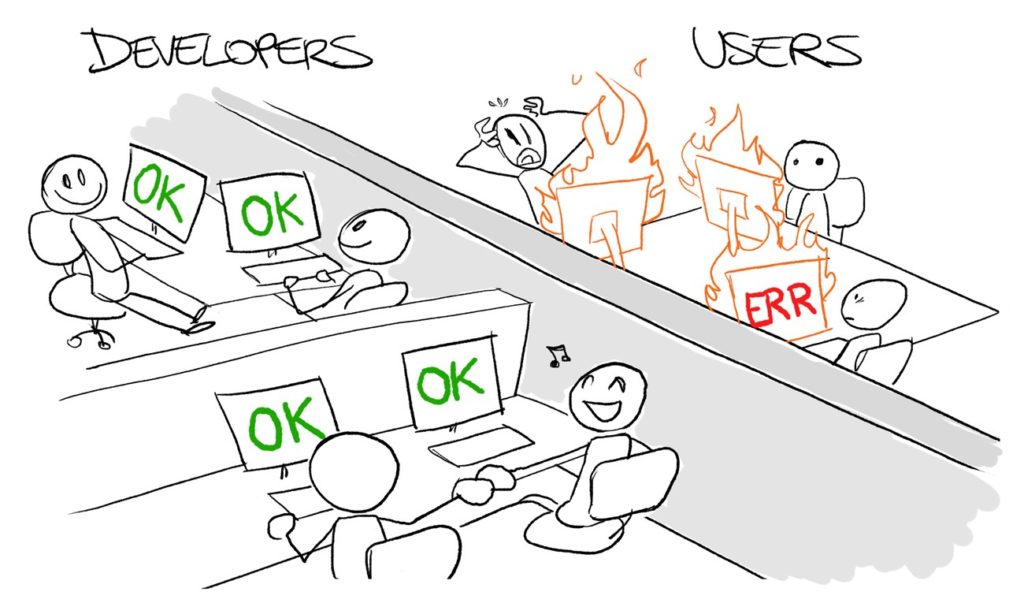
When considering just the technical side, things can go wrong in two different ways:
- Oblivious tech team: as shown in the above image, the monitoring of all the individual components indicate that everything are healthy, but the end-user does experience issues. This can happen if an overall vision and end-user perspective is missing, and each team only implemented metrics and alerts for the part of the system that they own.
- Oblivious end-user: this is the opposite situation: end-users don’t notice any problems, but your team is panicking, e.g. because the CPU saturation is suddenly very high. This is often caused by too noisy alerts, i.e., having alerts for technical aspects that should not have alerts at all, or because the thresholds were poorly chosen.
Naturally, many of the technical metrics coincidentally cover your end-user‘s needs, too, e.g. when monitoring error rates (the E in RED) of a web application. But the devil is in the details:
- Example #1: how many errors are problematic and should trigger an alert? 1% of all requests? 10%? What if the 1% affect the
/registerendpoint? Then you just lost 1% of potential new customers, who were unable to register, which is much worse (from a business perspective) than if the 1% had affected the/generate-pdf-reportendpoint. - Example #2: how much latency can your users tolerate? There is no single answer, it highly depends on the application, and your thresholds may range from 50ms to several minutes. For longer durations, the UI has to communicate the expected delay to your users, of course. If an operation that (from the user’s perspective) should be instant (e.g. clicking the “save button”) but isn’t, the user will consider the system to be a failing system (and might leave soon), while you, as an engineer, would just classify it as “a bit slow”.
This is where KPIs (Key Performance Indicators) come into play. For instance, you should build metrics that help you determine whether your business as a whole is growing or shrinking, e.g. by observing the number of logins / monthly active users, total number of customers, revenue, percentage of paying customers (if you have a free tier), data from surveys your users answered, etc. It is also useful to collect “in-app” analytics, e.g. how users use the search button.
To learn more about the KPIs of your business, don’t think like the CTO – think like your CEO, CFO, etc. Talk to people in your organization who are not engineers, e.g. the product owner, or customer support. Not only might you learn about aspects that your users care about that you did not know existed, but you might also be able to relax and lower some of the hard requirements or alert thresholds (e.g. when building an email server and you just learnt that users don’t mind if processing an outgoing mail takes up to 10 seconds). It can also be helpful to write down a description of what your service/application does (including its features and UI walk-throughs) and then analyze this description. There are also various articles that might inspire you with KPIs, e.g. here, here, or here.
Once you are at a point where you have alerts for both technical and business KPIs, try to correlate them. A strong correlation may sometimes help to explain why a KPI metric changed. For instance, if suddenly the Monthly Active User count (a KPI metric) started dropping, and you also identify a strong increase in your average service response time (a technical metric) that also started at the same time, this might be the cause for users leaving.
Good alert rule design
In general it is a good idea to classify alerts in two escalation levels:
- Critical: you need to do something about it now, otherwise the system might go down soon! E.g. because several services stopped working.
- FYI: something went wrong but it’s not critical, e.g. a failing backup, or disks slowly filling up.
In the “Practical monitoring” book, the second escalation level (FYI) is considered to be just a message, not an alert. Sending a FYI-type message to a chat room, or auto-generate a ticket, is sufficient. But critical alarm notifications need to be sent to in a way where you have a high confidence that someone definitely reads it very soon, e.g. an automatic phone call or sending text messages.
The book proposes several generic tips for good alert design:
- Stop using emails for alerts: emails usually won’t wake anyone up – SMS, pagers or phone calls do! Emails are more suited for message-type alerts.
- Write runbooks: a runbook is written for a specific service. It describes what this service is, what it does, who is responsible for it, what dependencies it has, what the infrastructure for it looks like, what metrics and logs it emits (and what they mean), and what alerts are set up for it (and why). For each alert, create a (clickable) link to the runbook of that service
- Avoid using arbitrary, static thresholds in your alert rule definitions. Instead, often something like the growth rate is more interesting.
- For instance: the static alert rule “only 10% disk space remaining” is less useful than “disk usage grew by X percent in the last 10 minutes”. Using the static rule, your system might still crash if the disk is rather small and a lot of data is generated in a short amount of time. What you actually want it is a warning at the “right time” (e.g. having two weeks of runway). The static “10%” percent value doesn’t give you this. Instead, you have to measure the rate at which the disk fills up, compute the number of days left (considering the free disk space), and then warn you if the number of days is below a threshold.
- Delete and tune alerts, so that you get as few alerts as possible. This reduces alert fatigue, which is the phenomenon where you start ignoring alerts because there are too many of them. Consider doing regular retrospectives on your alert history, e.g. of the last 30 days: what alerts happened, what had to be done to resolve them, could you modify the thresholds or write different rules to avoid noisy alerts? Were all those alerts necessary?
- Use the “silencing” feature of your observability tool, to temporarily disable alerts monitoring those services that you shut down during a maintenance period. Otherwise, the alerts would trigger for those shut-down services, increasing the risk of alert fatigue again.
- Attempt self-healing first: if there is a fixed set of instructions that fix an alert, consider automating their execution. Configure the alert system so that if it detects a problem for the first time, it executes the automated “healer” script, instead of triggering the alarm. The actual alarm is then only triggered on the second detection of the problem, in case the automated script was unable to heal the cause of the problem.
- Include seasonality analysis: rather than only writing alerting rules for the current system state, it also makes sense to find regularities, i.e., patterns in your data that start repeating after some amount of time. You can often identify such patterns simply by looking at the graphs in your dashboard. Next, you can write alerting rules that compare the current data to the pattern’s baseline, to identify whether something is wrong.
- For instance, web traffic is often seasonal, in the sense that you might find that your site or services gets more traffic on workday evenings, and even more traffic on weekends. Write alerting rules that compare your request rate with the rates of the previous week(s) or months. You can tell from sudden drops in the request rate deltas that something is wrong.
Context-specific observability tips
Let’s look at tips for building alerting rules and improve your observability in general, categorized by the layer in your overall system stack.
The core idea is to add instrumentation to your own application code, which exposes metrics that are specific to your application. It also means to research (and use) APM tools (Application Performance Monitoring), which analyze your code and automatically add instrumentation to your app, capturing generic things, such as request rates or garbage collection cycles.
As explained above, think in terms of your business when instrumenting your app. For instance, count the number of times a functionality was used. But there are also generic functionalities most applications have, like logging in, thus you can track the number of successful logins, from which you can compute daily or monthly active users.
You should also include build and deployment (CI/CD) events into your observability stack. Build metrics that indicate when the deployment of each version started and ended, as well as the deployment target (environment). Using your observability tool you can then correlate deployments with other events, e.g. detecting that after a certain deployment, the API failure rate started growing significantly.
Add /health API endpoints that indicate whether your application is healthy, and scrape their output with your observability system. There are different philosophies about whether the healthiness should be scoped to the component offering the health endpoint, or whether it should include other dependencies. For instance, should the /health endpoint of a web app also return status code 503 if the underlying DB service is not reachable? In “classical”, non-distributed apps, this would be expected behavior. But in a distributed environment, such as a Kubernetes-based application, you would separate the concerns. There are several types of health checks (liveness, readiness, startup), and you would usually limit health checking to only the component itself, to avoid cascading errors. Also make sure the health endpoint is not publicly accessible, to avoid leaking private information.
Another good source of information to debug problems is logging. I recommend you use structured logs, e.g. encoded as JSON. Think carefully about where you place log() calls – the log calls should help you diagnose a problem later!
Frontend monitoring refers to monitoring things that happen in the GUI (e.g. browser, native/desktop, or smartphone app). Frontend monitoring is often missed (like a blind spot), especially when people implementing monitoring are more operations- or backend-oriented.
The basic idea of a “good” UI (from a purely technical standpoint, ignoring UX aspects) is: elements must load quickly! Unresponsive, laggy UIs are a huge deal breaker. This is why applying observability to your UI is important.
There are two basic modes of testing:
- Black-box testing: observe performance issue from the outside, ignoring its code. For instance, if your app is a website/web app, use a service (like Webpagetest) to query your website, measuring the response times.
- White-box testing: you extend your own code to include performance measurements, and you also make sure to submit them to your observability system.
You should prefer white-box over black-box testing. It makes sense to use off-the-shelf components that simplify the task of creating such metrics – but you have to research which one to use, because there are many specialized solutions for each kind of frontend technology.
Observing your infrastructure / servers is a necessary step to achieve good observability, even if it is not the very first thing you should focus on. OS-level metrics, such as CPU, memory, disk, network usage, are useful to diagnose the cause of a problem. However, keep in mind that collecting metrics data does not imply that you should create alerting rules. It often does not make sense to set up alerts for OS-level metrics (unless you have a good reason), because they are noisy (creating many false positive alarms), and they are not related to your application.
As the devil is in the details (as always), here are a few pointers:
- CPU metrics: to get the proper CPU usage, sum up the
user,system,niced processes(ni),hardware interrupts(hi), andsoftware interrupts(si) usage. - Be very sparing with alerts on the “system load” (see here). There are many examples of systems that have a per-core load that is much higher than
1, but still work fine and are responsive. If the user does not notice a problem, there is nothing to fix! - Memory (RAM) metrics: compute the actually used memory by summing up shared+cached+buffered
- Buffers store recently accessed areas of the disk
- Caches work similarly to buffers, but for the contents of recently accessed files.
- The memory used by buffers/caches is technically available for use by any processes that need the memory.
- The output of the Linux CLI tool
freeshows the proper memory usage in the 2nd row (starting with “-/+ buffers/cache“), which accounts for the fact that memory consumed by buffers and caches can actually be claimed by other applications at any time. - You should also consider monitoring for out-of-memory errors, which are created whenever a process has to be killed because of running out of memory. Search the Internet for “OOMKiller” to find out more.
- Disk metrics:
- You generally want a low
iowaitvalue, because it represents the amount of time the CPU was idle due to waiting on the disk to complete operations. - It can also make sense to monitor the IOPS of a disk, but you need to first understand what a good baseline is, and then identify sudden drops (compared to that baseline).
- You generally want a low
There are different kinds of services you might be using, for which you should collect metrics. Here are a few hints:
- Web server metrics: apart from the usual suspects (RED -> requests/second, request duration, HTTP response codes) you can also measure the number of concurrent connections.
- DB server metrics: concurrent connections, queries per second, query duration (to detect slow queries)
- Cache server metrics: number of evicted items, and the “hit/miss ratio” (a.k.a. “cache-hit ratio”).
- Evicted items: a high number indicates that too little memory is assigned to the Cache server
- Hit/miss ratio: the lower this number, the worse the caching mechanism works
- Heartbeat monitoring: also referred to as “dead man’s switch” or “cron job monitoring” (search the Internet using these terms and you will find many providers) will detect the absence of a heartbeat signal and then notify you! This is useful to monitor your observability system itself.
- Consider monitoring any external services that you use, e.g. CDN servers – here you could monitor their hit/miss ratio or latency, or whatever metrics the CDN offers.
Networks are one of the fundamental underpinnings of any software app. If your network only has an availability of 99.9%, your application cannot possibly have any higher availability than that.
Many routers and other networking hardware implement the SNMP protocol, which you can use to query information from it. The concrete OIDs / values to monitor differ on each device, but the general metrics which you should monitor are: Throughput, latency (and jitter in latency), rx/tx errors/drops, CRC errors, connectivity errors, and various other errors.
You can also track device configuration changes, e.g. with tools such as Rancid, which regularly download the configuration from your routers (or other networking devices), compare it to the previous one, and notify you if a configuration has changed.
Application security is an extremely deep topic for which you need dedicated experts. Thus, the following tips are just a starting-off point!
- Use Linux tools like
auditd- Allows you to log activities such as:
- All sudo executions, the command executed, and who did it
- File access or changes to specific files, when, and by whom
- User authentication attempts and failures
- In the cloud-native ecosystem, you would use something like Falco instead of
auditd
- Allows you to log activities such as:
- Use a host intrusion detection system such as wazuh
- Regularly scan your deployments for security issues, e.g. with the OWASP Zed Attack Proxy
Incident response management
In the observability world, incident (response) management refers to a set of processes that deal with issues (such as triggered alerts) detected by your observability system. There are several frameworks out there, one of the most popular coming from ITIL, which has a formally-defined 9-step plan. In practice, most organizations don’t need to be this formal. A sequence like the following one can already be good enough:
- Identify the incident: usually done by the monitoring system,
- Log the incident, e.g. by having the monitoring system automatically open a ticket for the incident in some ticket management system, which might even be a incident management system specialized for such cases, such as Opsgenie,
- Diagnosis: categorize it, find possible resolutions, and resolve the incident, and update or close the corresponding ticket,
- Prevention: once resolved, find remedies to avoid that the problem keeps repeating in the future. This can include writing a post mortem.
A good source for further information about incident management is available here.
Testing observability in production
As I’ve outlined in part 1 of this Observability article series, implementing observability properly requires you to put extra work into all software development life-cycle phases – not just operations, but also development and testing.
This means that we should apply our general knowledge about testing to also test our observability system itself. Until now, most engineers associate testing with “testing application features“, which usually happens in a CI pipeline, which is an isolated, pre-production environment. Testing observability, in turn, means to build a replica of your production environment, and then simulate realistic load and failure conditions that trigger our observability system, while verifying that your observability worked as expected (e.g. that certain alarms were triggered). This can even be done in your actual production system, if you are careful. This lets you catch certain types of issues that would never occur in a pre-production environment such as a CI job, e.g. load-balancing issues that would only happen during high peak loads.
As the following figure shows, there are many different shapes and forms of testing in production:
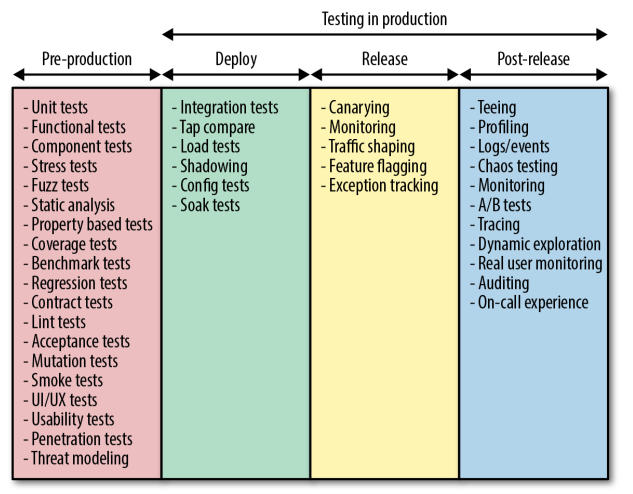
You can find more details about the sub-stages of above figure and the mentioned practices in this article series.
Conclusion
Getting a good level of observability is challenging. You need to approach it from both a business/end-user and a technical angle, which requires teamwork and time. Don’t expect that you get everything set up in a month or less, but actually account for observability to be a continuous process – just like keeping third party dependencies up to date, fighting technical debt, etc. Make sure that you, your team, and other stakeholders in your organization set the right priorities. Start building metrics and alerts for business KPIs first, then continue with other technical metrics of things that are invisible to your end-user (servers, etc.).
You should also avoid obsessing over tools, such as the agents, metric data stores, or visualization systems. It’s not the tools (or the number of tools) you are using that guarantee good observability. Sure, you should spend a few days researching different alternatives at the beginning (likely ending up with Prometheus :-D). But you should avoid continuously switching tools mid-way, just because they look shiny, or have new features. You should only switch (and accept the effort to implement the change) if the current tools hold you back from quickly implementing changes, or if the tools become discontinued.