In this Logging with Loki deep dive, I explain how log collection and analysis works in principle, and then demonstrate what separates Loki from other log storage solutions. I elaborate on the different Helm charts you can use to install Loki into your Kubernetes cluster and go into the installation process using the loki-stack chart in detail. I demonstrate how to write simple Loki queries with LogQL, and conclude by explaining the basic idea of Loki’s metric queries.
Kubernetes observability article series
This article is part of a series of blog posts about Kubernetes observability. You can find all other articles of the series here!
Introduction
To get good observability of a distributed system, you need to collect three kinds of observability data: metrics (which I discussed multiple times in this article series, especially here), traces, and logs. This article is about logs, presenting Loki, a log storage solution built by Grafana Labs, and how to install and use it in a Kubernetes cluster.
Before I dive into Loki, we first need to be aware of the basic idea of how log collection and processing works:
- Your code runs in containers, which run in Kubernetes pods. Your code (as well as other components & services that you use) produce logs. Instead of sending the log entries to (different) files, you configure
stdoutandstderras log destination. - The container engine (e.g. containerd) collects the output of all the containers
stdout/stderrchannels and forwards them to a central log file. - A logging agent (e.g. Promtail, Fluent Bit, or Fluentd) parses this central log file (in real-time), does some pre-processing, and then forwards the processed entries to a log storage, such as Loki.
- Pre-processing includes tasks such as converting the log entries to a format the log storage expects, or adding Kubernetes-specific target labels (key-value pairs), or filtering out specific log entries you don’t care about.
- The log storage stores the logs in some persistent data store, and indexes some (or all) of the received log entries. The index lets you efficiently search in these logs. As I discuss in the next section, the log storage implementations have very different approaches for indexing.
- Some log storage solutions (including Loki) extract metrics from logs, and send them to a metrics storage, such as Prometheus.
As you can see, logs are pushed – the pull approach (that Prometheus uses for metrics) is much less common in the logging world. If pushing the logs temporarily fails, the agent usually buffers (and re-transmits) the collected logs for a certain time period, to avoid data loss.
Loki vs. other solutions
Loki is just one of many solutions in the log storage space. There are many others, e.g. the ELK stack, which you can host yourself, or SaaS offerings (which usually collect and process not only logs, but also metrics and traces), such as Logz.io, Grafana Cloud, Splunk or Datadog.
These solutions differ in many aspects. To keep the scope small, let’s only consider the user interface, and how data is indexed and stored by the log storage solution:
- User interface: Loki does not come with a graphical user interface. Instead, you can either use the Loki CLI (docs), or configure Loki as data source in Grafana, which you then use to inspect, filter and analyze logs. All Loki configuration must be set using YAML files, just like Prometheus. In contrast, other (SaaS) solutions do come with their own proprietary UIs, which also let you change settings.
- Log indexing and storage: Loki focuses on being fast at ingestion-time, which it achieves by keeping the log processing to a minimum. Other solutions (such as the ELK stack) analyze the log message in detail, indexing every possible field, which takes time and increases the storage size of the search-index. In contrast, Loki’s philosophy is that you configure the log agents to only send a few selected labels along with the log message (e.g.
agent="promtail", job="somejob", service="postgres", instance="10.23.11.22"). Loki only indexes these labels, but not the message itself. This makes log processing much faster, and drastically reduces the search-index storage requirements (for 1 TB of logging data, Loki uses about 20 MB for the index). As you will learn below, Loki still allows you to do search queries in the (unindexed) log message. These queries are evaluated at run-time. You would think that this is slow, but it is not, because (in practice) you first limit the logs within you want to search, by consulting the metrics first. For instance, using Grafana and the Prometheus (metrics) data source, you narrow down the time range of where a service is malfunctioning to a time frame of one hour. Next, you only search for logs within that one-hour time frame, which is fast.
As for the supported data storage: Loki supports storing the log entries and indices either on disk (using a PersistentVolume in Kubernetes), or on other remote storages, such as GCS or S3 (see docs). As explained here, Loki 2.x supports clustering out of the box using the boltdb-shipper (docs), allowing you to have multiple (independent) Loki instances, which all synchronize their local index copy against a central storage.
While having low storage requirements is nice, the main driver of adopting Loki (vs. using other solutions) is the great level of integration with the other components of the Prometheus stack (Grafana, Prometheus, Alertmanager). This is no surprise, given that Grafana Labs is behind Loki and Grafana, Grafana being the de-facto standard for visualizing data in the Prometheus stack. You only need to add Loki as another data source in Grafana. Now, you can use a split view in Grafana to drill down into metrics and see a synchronized view of the corresponding logs, as demonstrated by this video. Assuming that you have basic knowledge of PromQL anyway, learning LogQL to query for logs is easy, because LogQL reuses many of the PromQL concepts.
Overview of installation options
There are many alternatives to installing Loki. If you are not using Kubernetes, you could just download the Loki binary, or start Loki using its official Docker image.
For Kubernetes, however, the recommended option is to use Helm charts. There are several charts, giving you primarily two options:
- Install Loki with the
lokiHelm chart, and separately install any logging agent of your choice (e.g. Fluent Bit, Fluentd, etc.), by installing their respective Helm chart. - Install Loki and either the promtail, fluentbit, filebeat or logstash agent, using the
loki-stackHelm chart.
With the first option, you have to learn the configuration options of the agents in detail, and adapt them. This is not necessary for the second option. Thus, option 2 is easier to use, so let’s take a detailed look it in the next section.
Installation using loki-stack Helm chart
As with any Helm chart, you should first take a look at the values.yaml file of the loki-stack chart. By default, the chart installs Loki (as StatefulSet, but without any PersistentVolumes!) and the promtail logging agent (as DaemonSet), which is also made by Grafana Labs.
The chart also has switches (which are disabled by default) to install other agents (Fluent Bit, Filebeat, or Logstash), or to install Prometheus or Grafana. I’ll assume that you already have a running Prometheus stack, e.g. using the kube-prometheus-stack Helm chart that I presented in my previous article. Consequently, I suggest not to touch those defaults which disable Prometheus and Grafana.
We need to customize a few configuration options of Loki, most notably regarding persistence, which is disabled by default!
Use a custom-loki.yml file such as the one below. It not only configures persistency, but also enables a few ServiceMonitors, which instruct your Prometheus server to scrape Loki and Promtail automatically:
loki:
  persistence:
    enabled: true
    # Customize this
    size: 20Gi
  config:
    table_manager:
      retention_deletes_enabled: true
      # Customize this: how long should logs be kept?
      retention_period: 1w
  serviceMonitor:
    enabled: true

promtail:
  serviceMonitor:
    enabled: trueCode language: YAML (yaml)
This configuration configures a global retention policy. Since Loki 2.3 it is also possible to configure custom retention periods, which are specific per log stream. A common use case fur custom policies is to delete high-frequency logs earlier than other (low-frequency) logs. To learn how this works, you need to study these docs in detail.
To install loki-stack, follow the official docs to add the Loki Helm chart repository to Helm. Next, use a command like this one to install the stack: helm upgrade --install <release-name, e.g. loki> grafana/loki-stack -n monitoring -f custom-loki.yml
In case you need a test application that produces logs, use the podinfo test app, and install its front- and backend following the instructions in its README. When installing it, add the --set logLevel=debug argument to enforce that the produced log contains every HTTP request made to the podinfo application.
The Grafana instance of your kube-prometheus-stack Helm release does not need any further configuration to detect Loki as data source. However, you may have to restart the Grafana Deployment / Pod(s) for Grafana to detect Loki.
After letting a few minutes pass (during which log collection happens), open Grafana’s Explore tab and switch to the Loki data source. It will show many different kinds of labels. These are dictated by the log agent’s configuration. The loki-stack Helm chart installed the promtail agent, whose default configuration produces the following labels (source):
- Every Kubernetes label that is assigned to the pod (see the
metadata.labelssection of aPod‘s YAML definition) becomes a log label in Loki, with a slugified key.- For instance, the Kubernetes label “
app.kubernetes.io/name=myapp” becomes a log label “app_kubernetes_io_name=myapp“
- For instance, the Kubernetes label “
pod, set to the name of the podcontainer, set to the container’s namenamespace, set to the container’s/pod’s namespacejob, set to<namespace>/<app label>filename, set to the host’s log file name
Querying with LogQL in Grafana
Let’s take a look at querying logs stored in Loki, using Grafana. I’ll assume that you are already somewhat familiar with Grafana. You can follow along on the Grafana demo instance, by visiting play.grafana.org. If you want, take a look at example queries by opening the dashboard called “Loki NGINX Service Mesh” and going to edit mode for any of its panels.
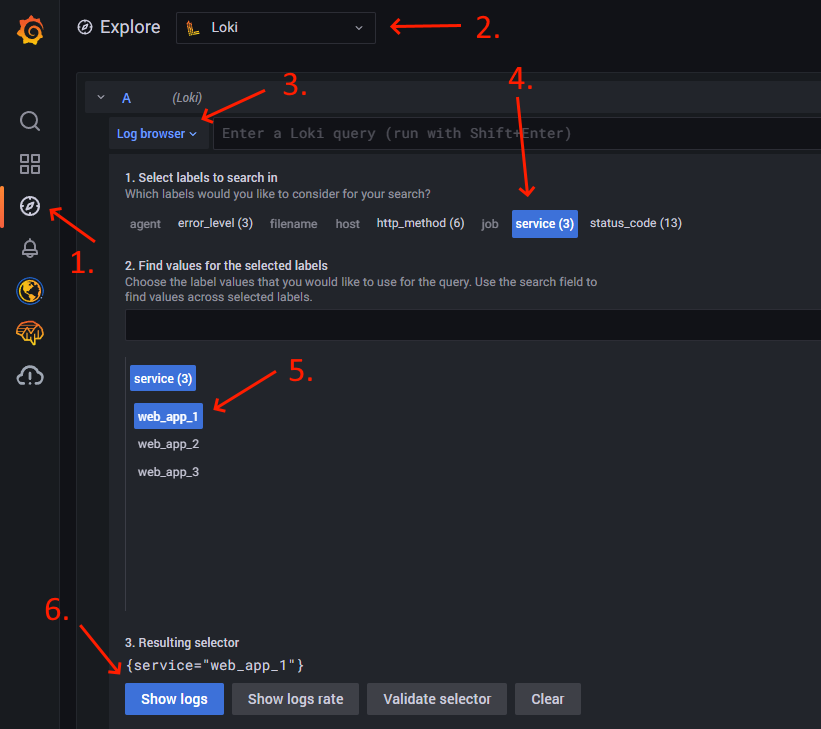
Let’s build our first query. The image below shows the sequence of necessary clicks. First, open the Explore view of the Grafana demo instance (1). Select the Loki data source (2). Click on the “Log browser” button to see which indexed label keys there are (3), such as agent, error_level, or filename. Click on any of the label keys (4) to see a sub-panel that lists the available label values. If you click on any of the values (5), Grafana will show the query that contains the label key and value (which is also referred to as selector, also in PromQL queries). Click on the “Show logs” button to use this query (6).
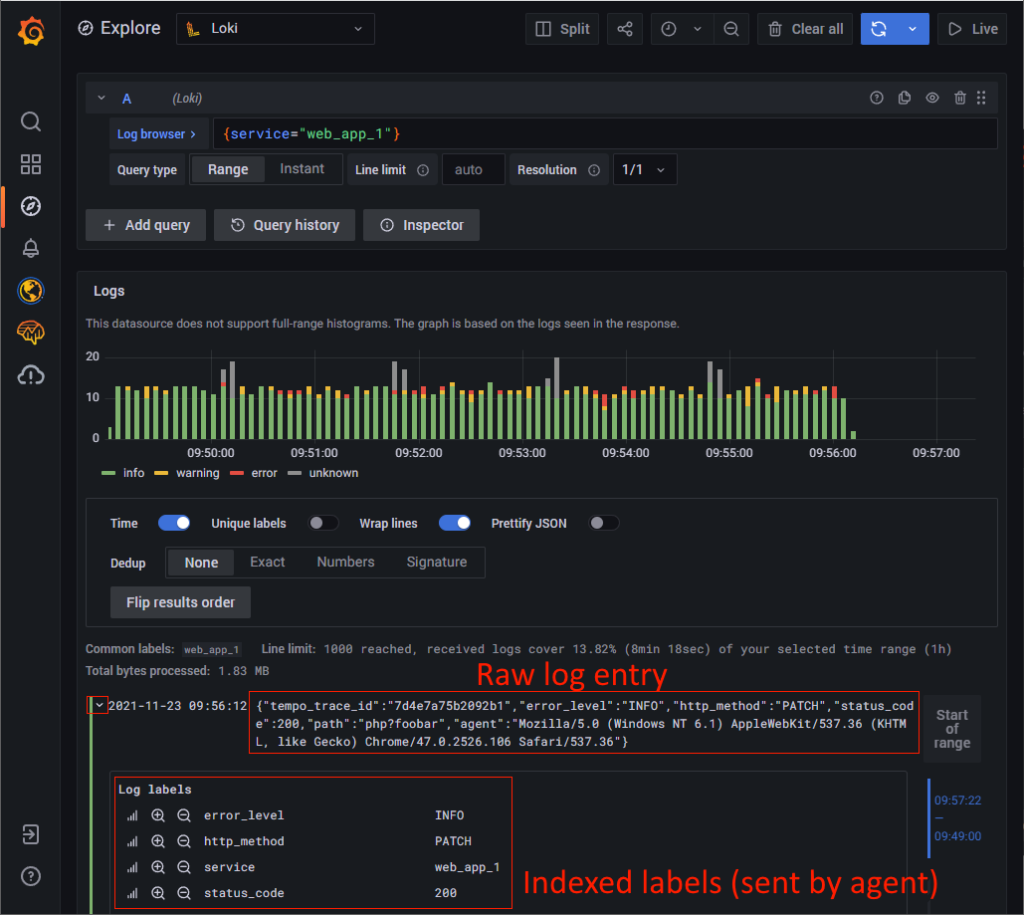
Grafana will show a raw list of the log entries (for your selected time range and selector query), together with a graph that counts the log entries over time. By clicking on the small arrow on the left of a log entry, Grafana will show you the indexed log labels, as well as fields detected at run-time by Grafana. The image below shows an example:
The next step is to narrow down the results. There are multiple approaches to do this, which you can also combine in a chain:
- Line Filters: these are grep-like searches that simply treat each log entry as an unstructured string,
- Parsers: these parse each line into a data structure that is made of additional labels, at run-time. You can then write queries against these labels.
- Label filters: label filter expressions let you filter log lines using their indexed and parsed labels. They can contain multiple predicates, e.g. using
and/or.
Let’s take a look at a few examples. You can copy&paste them into the Grafana query window, and use CTRL+Enter to run the query:
{filename="/var/log/nginx/access.log"} |= "GET /"- The bold part is a line filter, where
|=means “contains”. In other words, in this example we are filtering for log entries that contain the string “GET /“. The other available filters are:!=(does not contain)|~(regex)!~(negated regex).
- The bold part is a line filter, where
{filename="/var/log/nginx/json_access.log"} | json- The bold part is a parser. Here we chose the
jsonparser, which expects that each log entry is a valid JSON string, that it parses into a JSON object. By appending a label filter such as| status >= 400to the end of the query, we can now do structured search using these new dynamically-parsed labels (here:status). jsonis just one example for a parser. See the docs for a complete list. Others arelogfmt,pattern, orregex. Some of them require additional arguments.
- The bold part is a parser. Here we chose the
{filename="/var/log/nginx/access.log"} |= "GET /" | pattern "<ip> - - <_> \"<method> <uri> <_>\" <status> <size> <_> \"<agent>\" <_>" | status >= 400- This example combines line filters, parsers and label filters. We have the stream selector, line filter,
patternparser, and label filter. Thepatternparser expects Nginx log entries, and extracts specific named fields (such as<status>), and ignores some other fields (using the notation<_>). Because the start and end of the pattern is indicated by double-quotes, we need to escape all other literal quotes that the pattern matcher is supposed to match in the log entries. In the following example, the highlighted sections illustrate which parts of a log string are extracted by the parser: “0.191.12.2 - - [10/Jun/2021:09:14:29 +0000] "GET /api/plugins/versioncheck HTTP/1.1" 200 2 "-" "Go-http-client/2.0" "13.76.247.102, 34.120.177.193" "TLSv1.2" "US" "". Thepatternparser extracts the labelsip="0.191.12.2", method="GET", uri="/api/plugins/versioncheck", status=200, size=2, agent="Go-http-client/2.0".
- This example combines line filters, parsers and label filters. We have the stream selector, line filter,
Good to know: when looking at the filtered list of log entries, Grafana allows you to inspect the “context” of each log entry, that is, the unfiltered log entries immediately preceding or following some log entry. Just hover over any of the filtered log entries. Grafana temporarily displays a “Show context” button. Click it to reveal the context log entries.
Split view mode
Grafana’s Explore view has a split view mode, see the “Split” button at the toolbar at the top. Once enabled, a second panel will be shown, in which you can open Prometheus (or any other data source). To keep the time ranges in sync for both views, there is a “Sync all views” button.
A good use case for the split view is to diagnose a problem: in view #1, you configure Prometheus as data source. Use Prometheus metrics and PromQL queries to narrow down the time range, services, nodes, etc. that are affected by the problem. In view #2, switch to Loki as data source, and look at the logs of the affected services.
Creating metrics from logs
Metric queries (docs) are a feature where you tell Loki to turn logs to metrics. This is useful for several use cases, such as:
- Show these metrics as graphs in Grafana,
- Create alerting rules from these metrics, where Loki pushes alerts to Alertmanager
- Create recording rules from these metrics, which Loki pushes into Prometheus
An example for a metric query issum by (status) (count_over_time({job="nginx_access_log"} | json | __error__="" [5m]))
that you can run in the Explore view of the Play-instance of Grafana. The bold part is a “normal” LogQL query, which is turned into a metric query, by adding a range (via [5m]), wrapping it in functions (here: count_over_time()) and aggregations (here: sum). FYI, __error__="" is a meta-label which ensures that only those log lines are returned that the json parser could successfully parse. Please refer to the docs for further details about metric queries.
To learn how to configure alerting and recording rules, first read the rules/ruler section of the official docs. Unfortunately, this documentation only explains how things work if you were to directly work with configuration files on the host. In Kubernetes, things work a bit differently. The loki-stack Helm chart includes support for defining alerting rules right in the custom-values.yaml file. So if all you want is that Loki computes (throw-away) metrics that it only uses to sends alerts to your Alertmanager, just read the instructions in the values.yaml file of the loki-stack chart. However, if you want to set up recording rules, or want both alerting and recording rules, you need to do extra configuration leg work, using ConfigMaps, as explained below:
- First, create a new
ConfigMapthat contains the recording rules as a file (and optionally also contains your alerting rules, e.g. as second file, although you can also put both rules types into a single file). Apply thisConfigMapto your cluster withkubectl. Next, fill theextraVolumesandextraVolumeMountsvariables in yourloki-stackchart’scustom-values.yamlfile, so that the just-appliedConfigMapis mounted to/rulesof the Loki container. To make Loki care about the recording/alerting rule files in/rules, you need to copy the “ruler:” section from thevalues.yamlfile of theloki(!) chart to thecustom-values.yamlfile of yourloki-stackchart, adapting thealertmanager_urlto match the DNS of your Alertmanager instance (or setenable_alertmanager_discoverytotrue, see configuration reference). You also have to configure theremote_writekey, as explained here, so that computed values are actually pushed to your Prometheus instance. - In addition, you have to enable the “remote write receiver” feature flag (docs) in your Prometheus instances, so that they accept the metrics data pushed by Loki. To do so, set
prometheus.prometheusSpec.enableFeatures: ["remote-write-receiver"]in thecustom-values.yamlfile of yourkube-prometheus-stackHelm chart, and re-install the chart.
Expand the below box to see a complete configuration example that monitors the podinfo application.
Conclusion
Adding logs to your Prometheus-based observability stack is relatively easy, especially if you follow my instructions above. After the installation, you should expect that you will need to invest extra time into the following activities:
- Learning LogQL, in particular the metric queries (docs)
- Dashboard creation in Grafana: now that you have logs, you want to show them, incl. the metrics extracted from them
- Adapting labels so that the Loki and Prometheus labels match. Label mismatches make it hard to correlate metrics and logs in Grafana
- Fine-tuning of Loki and the agent, e.g. figuring out the required storage volume and scaling up your log storage (if necessary)
Hi, thank you for the article.
> The Grafana instance of your kube-prometheus-stack Helm release does not need any further configuration to detect Loki as data source.
I found that I had to manually specify the Loki datasource (though I used the official kube-prometheus non-helm stack) to the datasources configmap, how is it that it is automatically detected otherwise?
Sometimes Loki would only show up in Grafana after restarting Grafana – did you verify this?
Thanks for the Post , Much Detailed