This article helps you understand the basic Alertmanager and Prometheus concepts, such as metrics, time series, samples, alerts, and alert notifications. I also explain how data is conceptually stored, how you should approach instrumenting your application, and the basic idea of dashboards.
Kubernetes observability article series
This article is part of a series of blog posts about Kubernetes observability. You can find all other articles of the series here!
Introduction
The Prometheus stack is a popular set of tools used to achieve observability of your system. As indicated in the learning guide outlined in part I of this Observability article series, one important step (on the technical track) is to understand the basic Prometheus concepts and terminologies. You need to grasp them well, to be able to actually build alerts with PromQL. This article takes a detailed look at the basic concepts, such as metrics (and the different metric types), time series, samples, how data is stored, instrumentation, labels, alerts & alert notifications, and dashboards.
I recommend that you get your hands dirty from now on, by actually using the Prometheus stack. To get it up and running, you have several options:
- Use third party demo systems, such as http://demo.robustperception.io or https://demo.promlens.com – you don’t need to set up anything locally, but you cannot influence or change anything on these systems.
- Local Docker (compose)-based stack, see e.g. here or here for templates. This is the perfect solution if you’re running Linux natively on the host. However, if you are using Windows or macOS on your host, the caveat is that the node exporter of this Docker-compose setup won’t capture the metrics of your actual Windows/macOS host, but of the VM inside which the Docker containers are running. You might be better off using the bare metal option instead.
- Local bare metal installation: download the individual application binaries (of Prometheus, Alertmanager, Grafana, Pushgateway, node exporter, etc.) and install them manually. This will take the longest, but will teach you the most regarding the configuration of the applications.
Metrics, time series, samples and storage
Refining terminology
In previous articles of this series, I explained that your application (as well as third party exporters) expose “metrics data”, offering them via HTTP on a /metrics endpoint, in the “Prometheus format” with one metric per line. The used terms, like “metrics” or “metric data”, are actually imprecise – there are a few distinctions to make here. Let’s start by looking at an output snippet of the /metrics endpoint of Prometheus itself (click here to see the entire output):
# HELP net_conntrack_dialer_conn_attempted_total Total number of connections attempted by the given dialer a given name.
# TYPE net_conntrack_dialer_conn_attempted_total counter
net_conntrack_dialer_conn_attempted_total{dialer_name="alertmanager"} 2
net_conntrack_dialer_conn_attempted_total{dialer_name="node"} 1
net_conntrack_dialer_conn_attempted_total{dialer_name="prometheus"} 1
net_conntrack_dialer_conn_attempted_total{dialer_name="pushgateway"} 1
...
# HELP go_memstats_mspan_sys_bytes Number of bytes used for mspan structures obtained from system.
# TYPE go_memstats_mspan_sys_bytes gauge
go_memstats_mspan_sys_bytes 8.699904e+06
...
# HELP prometheus_http_response_size_bytes Histogram of response size for HTTP requests.
# TYPE prometheus_http_response_size_bytes histogram
prometheus_http_response_size_bytes_bucket{handler="/",le="100"} 1342
prometheus_http_response_size_bytes_bucket{handler="/",le="1000"} 1342
prometheus_http_response_size_bytes_bucket{handler="/",le="10000"} 1342
prometheus_http_response_size_bytes_bucket{handler="/",le="+Inf"} 1342
prometheus_http_response_size_bytes_sum{handler="/"} 38918
prometheus_http_response_size_bytes_count{handler="/"} 1342
...
# HELP prometheus_rule_evaluation_duration_seconds The duration for a rule to execute.
# TYPE prometheus_rule_evaluation_duration_seconds summary
prometheus_rule_evaluation_duration_seconds{quantile="0.5"} 4.4054e-05
prometheus_rule_evaluation_duration_seconds{quantile="0.9"} 7.1597e-05
prometheus_rule_evaluation_duration_seconds{quantile="0.99"} 0.00017088
prometheus_rule_evaluation_duration_seconds_sum 2.8554187595358095e+06
prometheus_rule_evaluation_duration_seconds_count 2.539804519e+09
...Code language: PHP (php)
What we called “metrics” or “metrics data” so far has some nuanced terminology. Using the above example output:
- A time series is something like
net_conntrack_dialer_conn_attempted_total{dialer_name="alertmanager"}orprometheus_rule_evaluation_duration_seconds_count. Basically everything is a time series that results a single line of output if you would type it in as query in the Prometheus query window, because you fixed the keys and values of all the metric’s labels (in case the metric does have any labels inside the curly braces). - A metric is something like
net_conntrack_dialer_conn_attempted_totalorprometheus_http_response_size_bytes, or anything else following the form# TYPE <metric name> <metric type>. A metric combines one (or more) time series. - A time series has its name because it consists of a series of samples. Samples are the actual data points stored in the TSDB. A sample has a timestamp (millisecond-precision) and a 64-bit floating point value.
- Note: Even though some of the values in the above example output look like integers, they are in fact floats, and they are processed and stored as such!
It is not always feasible to discern time series from metrics. For instance, a metric of type gauge that does not have labels, such as go_memstats_mspan_sys_bytes, the terms time series and metric do refer to the same thing.
Data storage – mental model
For most developers with a background in relational databases (and the SQL query language), building a mental model of Prometheus’ TSDB is challenging. In fact, the SQL model simply does not really apply. Doing mental gymnastics, imagining a metric to be like a relational table won’t work. If you really insist on building a table-based mental model, you can imagine that each time series is a separate table having a timestamp column and a value column, storing one sample per row. The following figure illustrates this: the Y axis represents time, each colored column on the X axis represents a different “table” / time series. Each dot is a sample:
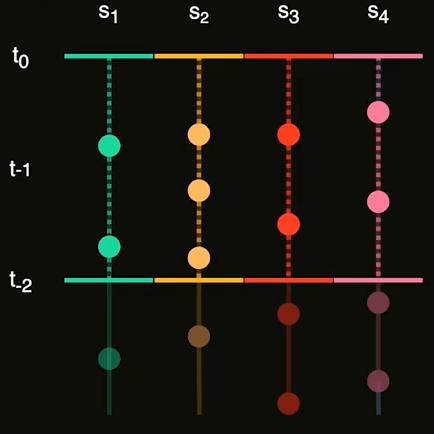
As you can see, the timestamps of the samples do not line up, thus it does not make sense to think of an entire metric to be represented by one table. Instead, you’d have a table for net_conntrack_dialer_conn_attempted_total{dialer_name="alertmanager"}, another one for net_conntrack_dialer_conn_attempted_total{dialer_name="node"}, etc.
Metric types
As the above example output indicates, there are several types of metrics (official docs) – most notably:
A counter metric is a simple number that counts something. Examples include the number of requests made to the application, the number of completed or failed jobs, etc. – for instance:
net_conntrack_dialer_conn_attempted_total{dialer_name="alertmanager"} 2Code language: JavaScript (javascript)The counter’s value is required to monotonically increase while the application producing this metric is running (keeping the counter’s value in volatile memory). However, the counter is allowed to reset (and thus, its value will decrease), in case the application has restarted, thus losing the previous counter’s value held in memory. Prometheus’ scraping routines intelligently handle such resets. For instance, if Prometheus scrapes a sequence of sample values such as 1, 4, 6, 2 it will actually store 1, 4, 6, 8 in the TSDB.
Like the counter, a gauge metric is a simple number, but it can arbitrarily go up and down over time. As the docs explain, “gauges are typically used for measured values like temperatures or current memory usage, but also “counts” that can go up and down, like the number of concurrent requests.”
As the official docs state:
A histogram samples observations (usually things like request durations or response sizes) and counts them in configurable buckets. It also provides a sum of all observed values.
A histogram with a base metric name of <basename> exposes multiple time series during a scrape:
- cumulative counters for the observation buckets, exposed as
<basename>_bucket{le="<upper inclusive bound>"}– the “le” stands for “less or equal” - the total sum of all observed values, exposed as
<basename>_sum - the count of events that have been observed, exposed as
<basename>_count(identical to<basename>_bucket{le="+Inf"})
Let’s use this knowledge to interpret the prometheus_http_response_size_bytes_bucket histogram from the above example snippet:
- The line
prometheus_http_response_size_bytes_bucket{handler="/",le="100"} 1342tells us that there were 1342 requests to the ‘/’ handler of Prometheus, producing HTTP responses whose size was less or equal to 100 bytes. - The other
_bucketlines have the same value (1342). Since Prometheus histograms are cumulative, this tells us that there were not any requests to the ‘/’ handler of Prometheus producing response sizes larger than 100 bytes. - The line
prometheus_http_response_size_bytes_count{handler="/"} 1342tells us that there were 1342 requests to the the ‘/’ handler of Prometheus in total. - The line
prometheus_http_response_size_bytes_sum{handler="/"} 38918tells us that the sum of all response sizes (of all 1342 requests) were 38918 bytes. Thus, we can compute the average response size ourselves if we are curious about it (because so far we only know that it is less than or equal to 100 bytes): just calculate
38918 / 1342 = 29 bytes.
A summary metric is very similar to a histogram, but it produces quantiles (over a sliding time window) instead of cumulative bins/buckets. See the official docs for detailed explanations of quantiles, and when to use summaries vs. histograms.
Analyzing our above example (prometheus_rule_evaluation_duration_seconds), we see that:
- Half (50%) of the rule evaluations take up to 0.000044054 seconds (0.044054 ms) – the other half takes longer
- The slowest 10% of rule evaluations take up to 0.000071597 seconds
- The slowest 1% of rule evaluations take up to 0.00017088 seconds
- Overall, 2.8554187595358095e+06 seconds (~33 days) were spent evaluating rules
- 2.539804519e+09 observations (rule evaluation duration measurements) were done by this exporter thus far
Built upon the above metric types, there are two more (rather undocumented) metric types you will often find in practice:
Since Prometheus only supports floating point values, you may wonder how you could express string values. Enum metrics are an approach that let you do that. For instance, you could create a metric named my_app_state for your application, which can take values “starting”, “running”, or “error”.
You should avoid using a single gauge metric, assigning arbitrary numeric values to the states (such that e.g. 1=starting, 2=running, 3=error), because then you can no longer use PromQL to aggregate values (e.g. have PromQL determine the number of “running” instances).
Instead, create as many time series of type gauge as you have states (here: 3), implement the string value as label, and assign boolean values (1=true, 0=false). Only one of the time series may have value 1 at any given time. Here is an example for what the /metrics endpoint of your application might return (for which you created the my_app_state enum metric):
# HELP my_app_state The state of your application
# TYPE my_app_state gauge
my_app_state{state="starting"} 1
my_app_state{state="running"} 0
my_app_state{state="error"} 0Code language: PHP (php)
Since setting a new enum metric value is no longer an atomic operation, you may run into race conditions, where a scrape sees a temporarily inconsistent state (with zero or more than one time series having 1s). A few Prometheus SDKs offer well-tested implementations of an Enum metric (see e.g. Python). If the SDK of your choice doesn’t have an implementation, the approach is to implement a custom collector that manages a gauge metric under the hood, and whose set(value) method avoids race conditions by using some kind of threading synchronization primitive (such as a mutex) that synchronizes the read and write requests.
Similar to the enum metric, the info metric also lets you express string values, even though Prometheus only offers floating point values. The idea of an info metric is to expose build information of any kind, such as version or build numbers. Having this information in a separate info metric is more cost effective, compared to adding this information redundantly to other, already existing metrics.
Here is an example of an info metric:
# HELP python_info Python platform information
# TYPE python_info gauge
python_info{implementation="CPython",major="3",minor="6",patchlevel="7",version="3.6.7"} 1Code language: PHP (php)
As you can see, the name of an info metrics has the _info suffix. The bits of build information you want to express are included as labels. The value is simply a dummy value of 1.
Instrumentation
In the Prometheus world, “instrumentation” refers to the process of adding extra code to several places in your own code base, to expose metrics data. These metrics are specific to your application. From a semantic point of view, they could be on a “low level”, e.g. the number of HTTP requests (if your application serves HTTP), or on a “high level”, e.g. number of time your users clicked on a specific button that triggers some feature of your application. You would typically use Prometheus SDKs built by the Prometheus community to facilitate this task (see here). These SDKs implement the HTTP server that serves the /metrics endpoint, and offer high-level methods you use to create metrics of different types, and update their values. The HTTP server managed by the SDK then exposes these metrics.
When you instrument your code, you have to find appropriate names for the metrics themselves, the labels for each metric, and you have to determine when it is better to start a completely new metric vs. creating additional labels for an existing metric. There are a few conventions you can follow:
- Metric names consist of multiple words separated by underscores. A typically-used scheme is:
<libraryname>_<unit>_<suffix>.- The
librarypart identifies your metric. It should be indicative of what the metric is about. You should also make sure that it is unique across all other existing metric names in the Prometheus ecosystem. It may consist of multiple words separated by underscore. - The unit is something like “seconds” or “bytes”, if applicable.
suffix: it is convention that gauge metrics have the suffix “_total“, whereas counter metrics don’t need a suffix. histograms and summary metrics have multiple lines (in the output of/metrics) with varying suffices: one line ending with_sum, one with_count, and several others (e.g._bucket{…}for histograms). Usually, the SDKs take care of generating those for you.
- The
- Labels differentiate the characteristics of the thing that the metric measures. They consist of key and value strings, where the key may have multiple words separated by underscore. I’ll go into more details about labels in the section below, where I also point out that a good choice of labels helps you to keep a low metric cardinality.
- You may wonder: when should I create a new metric, and when should I just add new labels to an existing metric? As explained in more detail in this article, the basic idea is that you can use PromQL to compute aggregates of your metrics (e.g. the sum, or the average over a time period you specify). However, these PromQL-aggregation-mechanisms only work well within a particular metric. In other words: you are always aggregating over the different labels of a specific metric. To answer the original question: you should keep adding labels to an existing metric, as long as aggregation operations (sum, etc.) over these labels are meaningful. For instance, if you have a metric
http_requests_total(with labels such aspath="/foo"etc.), and now you also want to include which service was serving the request, adding another label such asservice="users-directory"makes a lot more sense compared to creating a new metric such ashttp_requests_users_directory_total. However, if the aggregation of labels stops being meaningful, think about creating a new metric. - The official Prometheus manual also has some advice regarding metric and label naming.
Labels
In Prometheus (and also Kubernetes), labels are key-value pairs, where both the keys and values are strings. We say that two given labels are different if either the value or the key are different. For instance, the labels path="/" and path="/bar" are different!
Labels can be attached to metrics or alerts:
There are two categories of labels attached to a metric: target labels and instrumentation labels:
- Instrumentation labels are added by the instrumenting code. These are all the labels you see in the output of a
/metricsendpoint. - Target labels are added “afterwards” by the Prometheus server during the scrape (thus, you won’t see them in the output of a
/metricsendpoint), right before storing the new scraped sample of that metric in its TSDB. By default, Prometheus adds the target labelsjob="somejob"andinstance="somehost:9091", wheresomejobis the string you find in theprometheus.ymlin one of thejob_namefields, andinstancerefers to the concrete host or process whose/metricsendpoint was scraped. In theprometheus.ymlfile you can define additional target labels of your liking.
A useful feature regarding labels is relabeling. It solves the following important problem: suppose the output of the /metrics endpoint of some exporter (not written by you -> you cannot change it) is not suitable for your use case. For instance, the output might contain way too many metrics (which you don’t want to store), or some of the labels of some of the time series are unimportant to you, or you dislike their particular naming. Prometheus’ relabeling feature (docs) lets you drop or modify metrics and/or labels before storing them in the TSDB. This article presents the concept in detail.
One important caveat regarding the performance of Prometheus is cardinality, which refers to the number of time series in your TSDB. Having too many time series is problematic for the performance of PromQL queries, which require time series data to be in memory (e.g. for computing aggregates such as the sum). Your memory is limited, and consequently, so are the time series kept in memory. What drives the number of time series up? Mostly the labels (not metric names), because labels can have many different values. Consequently, you should avoid adding labels such as username="peter" to your metrics, because you might have millions of users, and thus produce millions of time series. The same applies to labels for email or IP addresses, etc. It also means that, for metrics that do you expect to have many labels, you should avoid using the metric type summary and histogram (and prefer gauges and counters instead), because these metric types add a lot of time series, for the different quantiles or buckets, to each of your own labels.
Prometheus produces an alert object (sending it to the Alertmanager) whenever the evaluation of a for: ... PromQL expression in your alert-rules.yml file produces one or more time series rows. By default, the labels of these rows (such as job="somejob", instance="host:port", and other metric-specific labels) are attached to this alert object. In the alert-rules.yml file you can define additional labels, e.g. severity="critical", which you can use in the matchers of the alert routing tree.
Alerts & alert notifications
As I’ve already discussed in this and in the previous articles, alerts and alert notifications are two separate concepts.
Alerts are just JSON objects sent by Prometheus to the Alertmanager. Prometheus not store the state of any alerts in its own data store. Consequently, Prometheus does not detect alert transitions (e.g. “alert started firing” vs. “alert stopped firing”). It simply sends alert objects whenever the evaluation of the PromQL expression of the corresponding alert-rule produces one or more time series rows, and otherwise it does not send any alerts.
The Alertmanager has the job of storing these alert objects, detecting “alert firing” transitions (by examining the presence and absence of the alerts it received over time), and generating alert notifications, which are sent to systems that actually produce an alert that the user can perceive – e.g. an SMS, email, etc.
Getting the Alertmanager configuration right does take some time at first, because you first need a good understanding of the alert routing tree concept (which is well explained in the official docs here), and of the grouping concept.
The basic idea of grouping (see group_by key in a route block in the Alertmanager config file) is to control the granularity of notifications. The docs do not explain it well. Here is my personal mental model for the grouping feature:
- Alertmanager creates one or more (what I call) “notification buckets” (one bucket per group), at every
routenode in the alert routing tree. Whenever an alert ends up at a node in the tree, Alertmanager then puts it into one of its buckets. - If you don’t specify any
group_byfor a node, then this node just has a single bucket / group. Once the sufficient group-thresholds have passed (most notably,group_wait), a single notification (e.g. email) is generated, which is very big, because it contains a long list of all those alerts that were routed to that node in the routing tree. - If you instead specify something like
group_by: [region]then Alertmanager will create as many notification buckets as there are values for the labelregionin the alerts. Alertmanager also creates one bucket for alerts that don’t have theregionlabel at all (Alertmanager interprets this as if the label was present, but had an empty string as value). Group-specific thresholds, such asgroup_wait, now apply separately to each notification bucket! As a result, notifications might fire less often (than if you don’t specify anygroup_by) because the buckets are “smaller”, and the content of the notifications will be smaller (the list will contain fewer alerts). - If you specify something like
group_by: [region, env](i.e., more than one element in the array) then Alertmanager will create a notification bucket for every possible combination of values of these given labels. Thus, if your system had 3 regions and 2 envs, you could have up to 3*2 = 6 notification buckets.
Dashboards
In the monitoring world, a dashboard is a collection of individual graphs, arranged as tiles in multiple rows and columns. In the Prometheus stack, Grafana is the go-to choice for building dashboards, and Grafana’s community maintains a huge repository of ready-to-use dashboard templates.
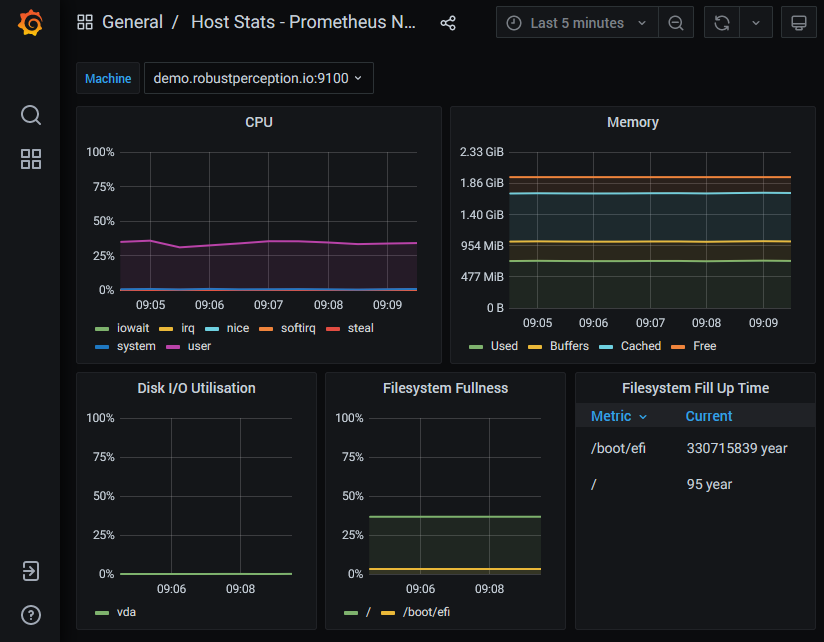
Having one (or more) dashboards help you to pinpoint a problem. As humans, we are much more effective at interpreting graphs, than looking at huge series of numbers. The purpose of a dashboard is to help you diagnose the root cause for a problem for which you received an alert notification. In other words: dashboards are not a means for alerting! You should avoid having a dashboard at which you have to stare all the time, to determine that something is wrong. Let alerts do this job instead.
The composition of dashboards is like an art and requires quite a bit of thought. It does not make sense to have huge dashboards with, say, 20 or more graphs, for various reasons, such as poor performance, and lack of overview. Look at general “dashboard design principles”, or specific best practice guides such as this one. You will usually end up building several dashboards, each focusing a special topic for a specific audience.
Conclusion
The explanations of terminology and concepts has hopefully helped you to get started with exploring Prometheus in more detail. The next logical step is to write alert (and recording) rules in PromQL, presented in the next article.
With the more refined terminology in mind, let me summarize the basic idea of an effective workflow to detect and fix problems with the Prometheus stack:
- Choose a large set of metrics you want to store in Prometheus’ TSDB, by choosing and scraping many third party exporters (for the third party services you are using, such as a database or message queue). Also, instrument metrics for your own application. The more metrics you store, the better, as they might be the key in diagnosing the problem (in step 3). Also, build dashboards for a subset of these metrics, with the help of Grafana’s pre-made dashboard catalogue.
- Configure just a few alert rules that indicate that something is wrong (or that there is a high probability that something will go wrong very soon). Otherwise, if you had too many alerts, you would receive too many alert notifications, and most likely discard them as spam.
- Once you receive a alert notification, open your dashboard(s) to more closely diagnose the problem, with the help of the graphs that illustrate the many metrics you collected.