I present my own hardware benchmark automation framework that creates a Kubernetes cluster with different VM types of your choice, schedules a containerized benchmark container on each node, and collects+processes the result. The framework is open source and available on GitHub. I also provide hints for how to visualize the results.
Benchmark series
This article is part of a multi-part series about benchmarking virtual cloud hardware:
- Part 1: Benchmarking virtual cloud hardware using 6 great tools
- Part 2: Hardware benchmarks with Phoronix Test Suite
- Part 3: Automated hardware benchmarks in Kubernetes (this article)
There is also the related Performance benchmark of over 30 Azure VMs in AKS you might find interesting.
Introduction
A hardware benchmark answers the question: “Given a specific software problem that is executed for a limited time period, how well does the software perform on different (virtual) hardware?”. I explain the hardware benchmark concept in depth in part 1 of this series.
Today, software is often deployed to container-based environments, such as Container-as-a-Service (e.g. managed Kubernetes cluster like AKS), Platform-as-a-Service (where you provide code which the platform then runs in containers, e.g. Azure App Service), or Function-as-a-Service (e.g. Azure Functions).
Cloud providers offer a plethora of configuration options regarding the virtual hardware, ranging from:
- “low degree”, e.g. if you can merely choose the number of vCPU cores, e.g. in Azure Container Instances (docs), to
- “high degree”, e.g. ability to choose the VM size and local disk node for AKS (docs).
To make the right hardware choice, you need a container image that contains your benchmark tools. Part 2 of this series explains how to build such an image, based on Phoronix Test Suite.
In this third part, I look at the still unsolved problem of how to automate the benchmark process itself. More precisely: we need a framework that…
- creates the different VM types that should be tested,
- schedules the benchmark on these VMs,
- collects and processes the results.
Finally, we need means to visualize the results, to get an understanding of the huge pile of numbers.
Automated hardware benchmark framework for Kubernetes
Because I was unable to find an existing benchmark framework, I developed my own framework, which you find on GitHub here.
I decided to use Kubernetes, because:
- it is a very popular platform and most of our projects use it to run our workloads
- provisioning nodes of different type is very easy, as it requires only very few lines of Terraform code
- running workloads on specific nodes is straightforward, by scheduling
Podswith anodeSelectorin the Pod specification
The GitHub repository contains a scripting framework based on Terraform, the Phoronix Test Suite Docker image created in part 2, and a Python script, which performs hardware benchmarks on a Kubernetes cluster.
In detail, the benchmark framework performs the following steps:
1. Create a Kubernetes cluster using Terraform, with one node pool for each VM type you want to benchmark. This repo contains an example for Azure Kubernetes Service (AKS), but it can easily be extended to support other providers, such as AWS Elastic Kubernetes Service (EKS).
2. Deploy one Pod per VM type in the just-created Kubernetes cluster, pinning it to the right VM type via a nodeSelector. This Pod has only one container, running our customized Phoronix Test Suite Docker image (which runs CPU & disk performance benchmarks).
3. Wait for all Pods to complete, then collect and parse their logs, producing a CSV file named benchmark_results.csv with the combined results. The CSV file has the following structure:
Tool name + config + result unit;<vm type 1>;<vm type 2>;...
7-Zip Compression - Test: Compression Rating (MIPS);<vm type 1 result>;<vm type 2 result>;...
7-Zip Compression - Test: Decompression Rating (MIPS);<vm type 1 result>;<vm type 2 result>;...
Flexible IO Tester - Disk Random Write, Block Size: 256KB (IOPS);<vm type 1 result>;<vm type 2 result>;...
Flexible IO Tester - Disk Random Write, Block Size: 256KB (MB/s);<vm type 1 result>;<vm type 2 result>;...
...<more results>...Code language: plaintext (plaintext)
Note that the raw results (the Pod logs) are also stored in the raw-logs/<YYYY-MM-DD-HH-mm> directory, in case you want to re-parse them later (after the Kubernetes cluster has already been destroyed).
4. Destroy the Kubernetes cluster using Terraform
This framework can be easily extended to run other benchmarks (e.g. to benchmark GPU capabilities), by using a different Docker image.
The repository’s README contains further details regarding how to configure the VM types and how to run the benchmark.
Visualization of hardware benchmark results
As humans, it is very difficult to understand or compare huge sets of numbers, such as CSV files. A visual comparison is much easier to grasp.
While there is a lot of tooling for visualizing data (just consider the plethora of Business Intelligence tools), any spreadsheet editor of your choice (e.g. Excel or Google Sheets) should be able to do the job. You can import the CSV file generated by my benchmark script into a new spreadsheet file, then create various filters and graphs. I recommend that you also build a table that contains meta-data about the VM types, e.g. the (nominal) vCPU count and price, or the alleged disk throughput and IOPS, so that you can better relate the results, or compute the price-performance-ratio.
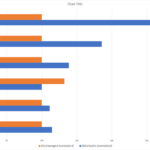
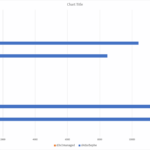
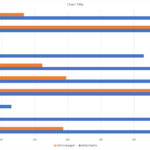
The repository contains an example Excel sheet for your convenience, where two different VM types of an Azure AKS cluster are compared. Here are the graphs contained in the Excel sheet:
These test results illustrate that a “v5” VM generation of the D-series in Azure mostly offers better single- and multi-core CPU performance than an older “v2” generation. Also, disk performance of nodes that can be configured to use a hypervisor-local ephemeral OS disk vastly outperform the managed disk that is mounted to AKS VMs by default. Note that part 4 of this series shows the full benchmark results, including many other VM sizes available in Azure.
Conclusion
This benchmark suite should greatly accelerate your own efforts to measure the performance of different Kubernetes VM/node types, for your chosen cloud provider. However, if you use a different environment (e.g. scheduling your software on VMs directly, or using some FaaS-platform), you will have to write a new automation framework. Similarly, other systems (like databases or message brokers) need entirely different kinds of benchmarks (see links in part 1).


