This article uses my fully-automated benchmark suite which creates a temporary Azure Kubernetes cluster (AKS) with over 30 different Azure VM sizes, schedules a container-based benchmark on each VM (which measures CPU and disk performance), and collects + visualizes the results. I share the raw results and an Excel sheet with various meta-information and graphs, as well as my interpretation of the benchmark results.
Introduction
A hardware performance benchmark answers the question: “Given a specific software problem that is executed for a limited time period, how well does the software perform on hardware #A vs. hardware #B?”.
When running software in the cloud, which has many different server and storage types, you may probably wonder which cloud provider (or which VM size) you should choose, to run your software on. Your goal will be to get the highest performance at the lowest possible costs, where “performance” could e.g. refer to CPU computational power, or disk / network speed.
One of the most popular approaches to run software today is to deploy it as containers, in a managed orchestration environment such as Kubernetes. That is why I decided to build an automated open source benchmark suite and run it against a Kubernetes cluster hosted in Azure. However, you can easily fork and adapt my benchmark suite and run other kinds of benchmarks, or run them against Kubernetes clusters of other cloud providers.
Benchmark parameters
I executed the benchmarks (and collected meta-data) on 2023-12-26. Consequently, my analysis is based on the hardware (and prices) available from Azure at that time.
Before benchmarking, I made several decisions:
- I chose Europe West as region, somewhat arbitrarily (because I’m living in Europe), but use USD prices because the official Azure rates are always expressed in USD and then converted to other currencies, so I just omitted the last step, for simplicity.
- I only tested Linux VMs, because my company exclusively uses Linux machines, and I’m assuming that there is little performance difference between Linux vs. Windows VMs.
- I chose 8 vCPU cores for all instances, to get a good indication of the multi-core performance (compared to single-core performance), and because an 8 vCPU-core-count was available for all chosen VM sizes.
The following 32 VM sizes were tested:
| Category | Series | VM type | RAM (GB) | CPU model (as reported by OS) | Fastest disk type |
| General purpose | Av2 | Standard_A8_v2 | 16 | Intel Xeon E5-2673 v4 (Broadwell) | Standard SSD |
| DCsv2 | Standard_DC8_v2 | 32 | Intel Xeon E-2288G (Kaby/Coffee/Whiskey Lake) | Ephemeral local storage (400 GB) | |
| DCsv3 and DCdsv3 | Standard_DC8ds_v3 | 64 | Intel Xeon Platinum 8370C @ 2.80GHz (Ice Lake) | Ephemeral local storage (600 GB) | |
| Dv2 and DSv2 | Standard_D4_v2 | 28 | Intel Xeon E5-2673 v4 (Broadwell) | Standard SSD | |
| Dv2 and DSv2 | Standard_DS4_v2 | 28 | Intel Xeon E5-2673 v4 (Broadwell) | Ephemeral local storage (56 GB) | |
| Dv3 and Dsv3 | Standard_D8_v3 | 32 | Intel Xeon Platinum 8171M (Cascade Lake) | Standard SSD | |
| Dv3 and Dsv3 | Standard_D8s_v3 | 32 | Intel Xeon E5-2673 v4 (Broadwell) | Ephemeral local storage (64 GB) | |
| Dv4 and Dsv4 | Standard_D8_v4 | 32 | Intel Xeon Platinum 8272CL (Cascade Lake) | Standard SSD | |
| Dv4 and Dsv4 | Standard_D8s_v4 | 32 | Intel Xeon Platinum 8272CL (Cascade Lake) | Premium SSD | |
| Dv5 and Dsv5 | Standard_D8_v5 | 32 | Intel Xeon Platinum 8370C @ 2.80GHz (Ice Lake) | Standard SSD | |
| Dv5 and Dsv5 | Standard_D8s_v5 | 32 | Intel Xeon Platinum 8370C @ 2.80GHz (Ice Lake) | Premium SSD | |
| Dav4 and Dasv4 | Standard_D8as_v4 | 32 | AMD EPYC 7763 64-Core (Zen 3) | Ephemeral local storage (64 GB) | |
| Ddv4 and Ddsv4 | Standard_D8d_v4 | 32 | Intel Xeon Platinum 8272CL (Cascade Lake) | Ephemeral local storage (300 GB) | |
| Dasv5 and Dadsv5 | Standard_D8ads_v5 | 32 | AMD EPYC 7763 64-Core (Zen 3) | Ephemeral local storage (300 GB) | |
| DCasv5 and DCadsv5 | Standard_DC8ads_v5 | 32 | 19/01 (Family 25 Model 1) | Ephemeral local storage (300 GB) | |
| Dpsv5 and Dpdsv5 | Standard_D8pds_v5 | 32 | ARMv8 Neoverse-N1 | Ephemeral local storage (300 GB) | |
| Dplsv5 and Dpldsv5 | Standard_D8plds_v5 | 16 | ARMv8 Neoverse-N1 | Ephemeral local storage (300 GB) | |
| Dlsv5 and Dldsv5 | Standard_D8lds_v5 | 16 | Intel Xeon Platinum 8370C @ 2.80GHz (Ice Lake) | Ephemeral local storage (300 GB) | |
| Compute-optimized | Fsv2 | Standard_F8s_v2 | 16 | Intel Xeon Platinum 8272CL (Cascade Lake) | Ephemeral local storage (64 GB) |
| Memory-optimized | Dv2 and Dsv2 | Standard_DS13_v2 | 56 | Intel Xeon Platinum 8171M (Cascade Lake) | Ephemeral local storage (112 GB) |
| Ev3 and Esv3 | Standard_E8s_v3 | 64 | Intel Xeon Platinum 8272CL (Cascade Lake) | Ephemeral local storage (128 GB) | |
| Eav4 and Easv4 | Standard_E8a_v4 | 64 | AMD EPYC 7452 32-Core (Zen 2) | Ephemeral local storage (200 GB) | |
| Edv4 and Edsv4 | Standard_E8ds_v4 | 64 | Intel Xeon Platinum 8272CL (Cascade Lake) | Ephemeral local storage (300 GB) | |
| Ev4 and Esv4 | Standard_E8s_v4 | 64 | Intel Xeon Platinum 8272CL (Cascade Lake) | Premium SSD | |
| Ev5 and Esv5 | Standard_E8s_v5 | 64 | Intel Xeon Platinum 8370C @ 2.80GHz (Ice Lake) | Premium SSD | |
| Ebdsv5 and Ebsv5 | Standard_E8bds_v5 | 64 | Intel Xeon Platinum 8370C @ 2.80GHz (Ice Lake) | Ephemeral local storage (300 GB) | |
| Edv5 and Edsv5 | Standard_E8d_v5 | 64 | Intel Xeon Platinum 8370C @ 2.80GHz (Ice Lake) | Ephemeral local storage (300 GB) | |
| Easv5 and Eadsv5 | Standard_E8ads_v5 | 64 | AMD EPYC 7763 64-Core (Zen 3) | Ephemeral local storage (300 GB) | |
| ECasv5 and ECadsv5 | Standard_EC8ads_v5 | 64 | 19/01 (Family 25 Model 1) | Ephemeral local storage (300 GB) | |
| Epsv5 and Epdsv5 | Standard_E8pds_v5 | 64 | ARMv8 Neoverse-N1 | Ephemeral local storage (300 GB) | |
| Storage-optimized | Lsv3 | Standard_L8s_v3 | 64 | Intel Xeon Platinum 8370C @ 2.80GHz (Ice Lake) | Ephemeral local storage (80 GB) |
| Lasv3 | Standard_L8as_v3 | 64 | AMD EPYC 7763 64-Core (Zen 3) | Ephemeral local storage (80 GB) |
Whenever possible, I configured ephemeral OS disks (see here and here) for the AKS nodes, as they presumably offer better disk performance.
The benchmark duration is approximately 1h 15 minutes, the costs per benchmark are roughly 20€.
I skipped the following VM sizes or series:
- GPU / FPGA / High performance series, because I did not have meaningful benchmark suites that stress their specific strengths
- DCas_cc_v5 and DCads_cc_v5-series: still in preview, and only comes with managed disks
- DCesv5 / ECesv5, because Terraform refused to create an instance, showing the following error:
The VM size 'Standard_DC8eds_v5' is not supported for creation of VMs and Virtual Machine Scale Set with '<NULL>' security type. - Lsv2 series, because they are apparently not supported in West Europe
- FX and M series: I hit the Azure quota limit
This was the vars.auto.tfvars.json file (click to expand):
{
  "node_pools": {
    "f8sv2eph": {
      "vm_size": "Standard_F8s_v2",
      "os_disk_type": "Ephemeral",
      "os_disk_size_gb": 64
    },
    "ds13v2eph": {
      "vm_size": "Standard_DS13_v2",
      "os_disk_type": "Ephemeral",
      "os_disk_size_gb": 100
    },
    "e8sv3eph": {
      "vm_size": "Standard_E8s_v3",
      "os_disk_type": "Ephemeral",
      "os_disk_size_gb": 128
    },
    "e8av4eph": {
      "vm_size": "Standard_E8a_v4",
      "os_disk_type": "Ephemeral",
      "os_disk_size_gb": 128
    },
    "e8dsv4eph": {
      "vm_size": "Standard_E8ds_v4",
      "os_disk_type": "Ephemeral",
      "os_disk_size_gb": 128
    },
    "e8sv4man": {
      "vm_size": "Standard_E8s_v4",
      "os_disk_type": "Managed",
      "os_disk_size_gb": 128
    },
    "e8sv5man": {
      "vm_size": "Standard_E8s_v5",
      "os_disk_type": "Managed",
      "os_disk_size_gb": 128
    },
    "e8bdsv5eph": {
      "vm_size": "Standard_E8bds_v5",
      "os_disk_type": "Ephemeral",
      "os_disk_size_gb": 128
    },
    "e8dv5eph": {
      "vm_size": "Standard_E8d_v5",
      "os_disk_type": "Ephemeral",
      "os_disk_size_gb": 128
    },
    "e8adsv5eph": {
      "vm_size": "Standard_E8ads_v5",
      "os_disk_type": "Ephemeral",
      "os_disk_size_gb": 128
    },
    "ec8adsv5eph": {
      "vm_size": "Standard_EC8ads_v5",
      "os_disk_type": "Ephemeral",
      "os_disk_size_gb": 128
    },
    "e8pdsv5eph": {
      "vm_size": "Standard_E8pds_v5",
      "os_disk_type": "Ephemeral",
      "os_disk_size_gb": 128
    },
    "l8sv3eph": {
      "vm_size": "Standard_L8s_v3",
      "os_disk_type": "Ephemeral",
      "os_disk_size_gb": 80
    },
    "l8asv3eph": {
      "vm_size": "Standard_L8as_v3",
      "os_disk_type": "Ephemeral",
      "os_disk_size_gb": 80
    },
    "a8v2man": {
      "vm_size": "Standard_A8_v2",
      "os_disk_type": "Managed",
      "os_disk_size_gb": 128
    },
    "dc8v2eph": {
      "vm_size": "Standard_DC8_v2",
      "os_disk_type": "Ephemeral",
      "os_disk_size_gb": 128
    },
    "dc8dsv3eph": {
      "vm_size": "Standard_DC8ds_v3",
      "os_disk_type": "Ephemeral",
      "os_disk_size_gb": 128
    },
    "d4v2man": {
      "vm_size": "Standard_D4_v2",
      "os_disk_type": "Managed",
      "os_disk_size_gb": 128
    },
    "ds4v2eph": {
      "vm_size": "Standard_DS4_v2",
      "os_disk_type": "Ephemeral",
      "os_disk_size_gb": 56
    },
    "d8v3man": {
      "vm_size": "Standard_D8_v3",
      "os_disk_type": "Managed",
      "os_disk_size_gb": 128
    },
    "d8sv3eph": {
      "vm_size": "Standard_D8s_v3",
      "os_disk_type": "Ephemeral",
      "os_disk_size_gb": 64
    },
    "d8v4man": {
      "vm_size": "Standard_D8_v4",
      "os_disk_type": "Managed",
      "os_disk_size_gb": 128
    },
    "d8sv4man": {
      "vm_size": "Standard_D8s_v4",
      "os_disk_type": "Managed",
      "os_disk_size_gb": 128
    },
    "d8v5man": {
      "vm_size": "Standard_D8_v5",
      "os_disk_type": "Managed",
      "os_disk_size_gb": 128
    },
    "d8sv5man": {
      "vm_size": "Standard_D8s_v5",
      "os_disk_type": "Managed",
      "os_disk_size_gb": 128
    },
    "d8asv4eph": {
      "vm_size": "Standard_D8as_v4",
      "os_disk_type": "Ephemeral",
      "os_disk_size_gb": 64
    },
    "d8dv4eph": {
      "vm_size": "Standard_D8d_v4",
      "os_disk_type": "Ephemeral",
      "os_disk_size_gb": 128
    },
    "d8adsv5eph": {
      "vm_size": "Standard_D8ads_v5",
      "os_disk_type": "Ephemeral",
      "os_disk_size_gb": 128
    },
    "dc8adsv5eph": {
      "vm_size": "Standard_DC8ads_v5",
      "os_disk_type": "Ephemeral",
      "os_disk_size_gb": 128
    },
    "d8pdsv5eph": {
      "vm_size": "Standard_D8pds_v5",
      "os_disk_type": "Ephemeral",
      "os_disk_size_gb": 128
    },
    "d8pldsv5eph": {
      "vm_size": "Standard_D8plds_v5",
      "os_disk_type": "Ephemeral",
      "os_disk_size_gb": 128
    },
    "d8ldsv5eph": {
      "vm_size": "Standard_D8lds_v5",
      "os_disk_type": "Ephemeral",
      "os_disk_size_gb": 128
    }
  }
}Code language: JSON / JSON with Comments (json)
Naming schema for VM sizes
This benchmark creates one AKS node pool for each benchmarked VM size. AKS imposes strict naming limits for node pools: only up to 12 lower-case alphanumeric characters are allowed. Consequently, VM sizes like Standard_D8s_v3 become d8sv3eph: we strip “Standard_” because it conveys no real information, remove all underscores characters, and append either a “man” or “eph” suffix, to indicate whether the node uses a managed disk vs. an ephemeral OS disk. The Excel sheets also use these naming conventions.
Analysis of Azure VM performance results
I used this Excel template into which I imported the CSV data and visualized the results. To obtain a large part of the meta-data, I built a helper script that parses the Azure pricing “API” (which is just a huge JSON file that the Azure pricing calculator downloads), to produce the table shown in the “Meta-data” sheet of the Excel file.
You can download the raw results and the Excel file from here. The Excel file contains multiple sheets: the meta-data sheet as well as several sheets for CPU performance and disk performance respectively.
Analysis of CPU performance
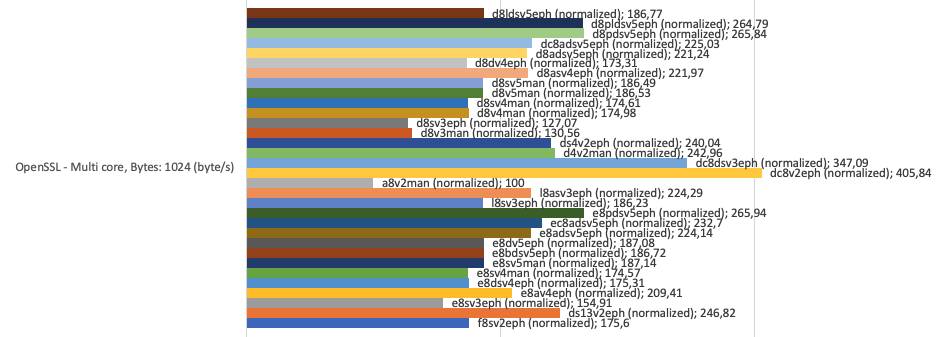
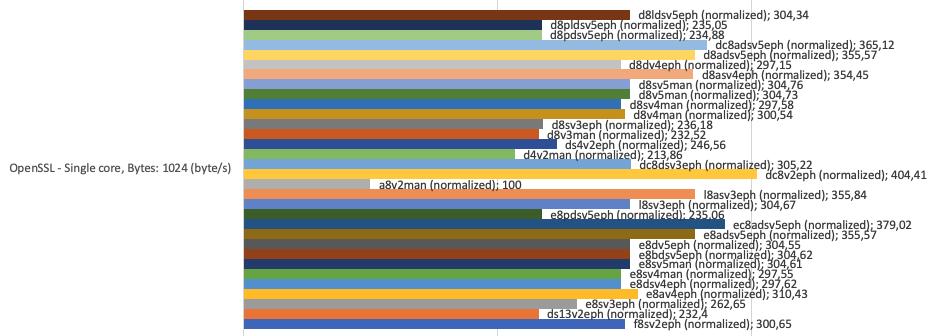
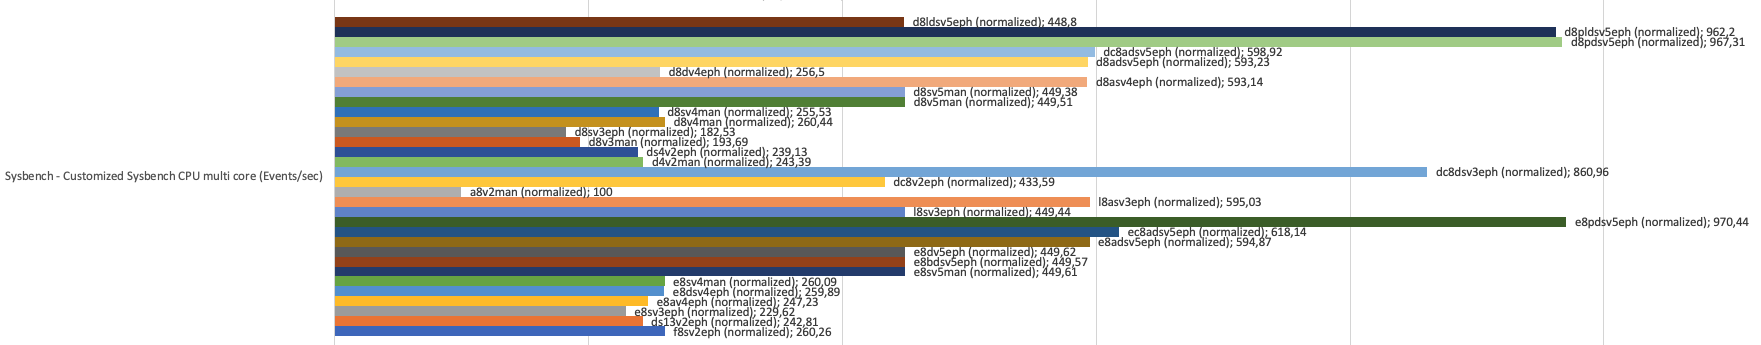
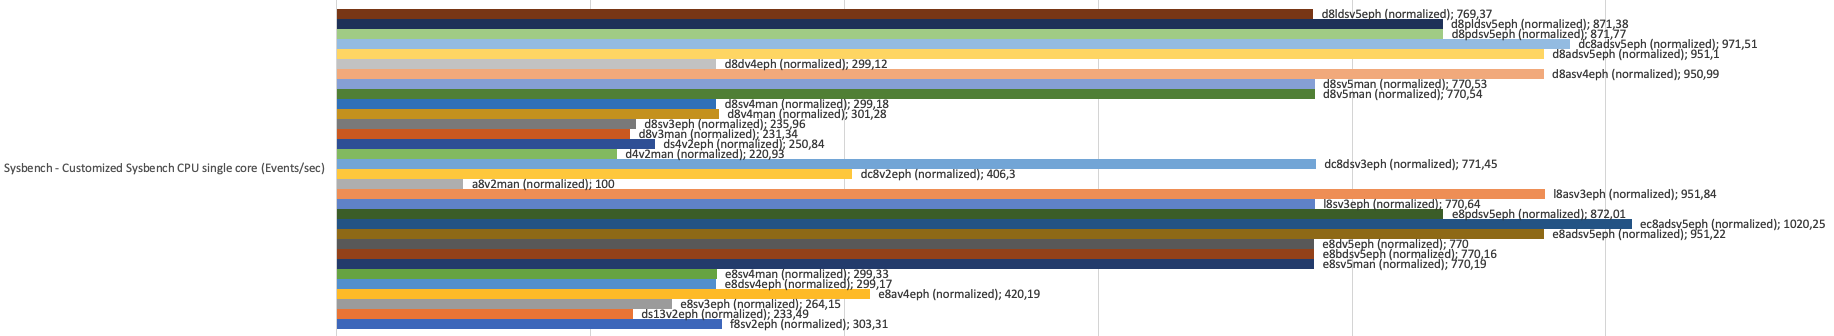
The Excel sheet named “Results CPU normalized” shows a table (and corresponding graph) of 6 different CPU performance tests:
- 2x Sysbench CPU test computing prime numbers, split into a single- and multi-core test variant
- 2x OpenSSL CPU benchmark that runs a hashing algorithm, split into a single- and multi-core test variant
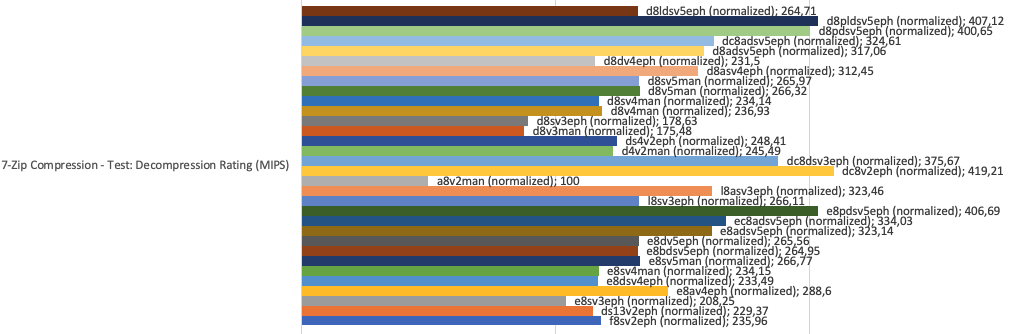
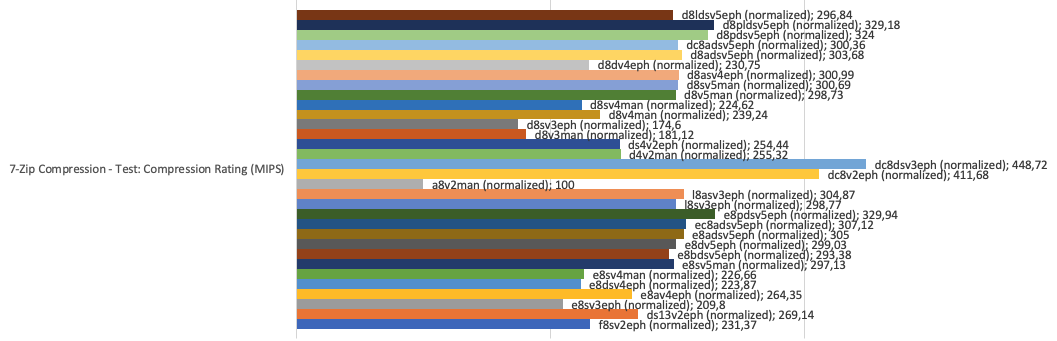
- 2x 7-zip benchmark, split into a compression and decompression test variant (each test is multi-core only)
Because each tool computes different kinds of scores of very different range, it would make no sense to plot them all in one graph. Absolute numbers are not interesting anyway, relative scores are easier to comprehend.
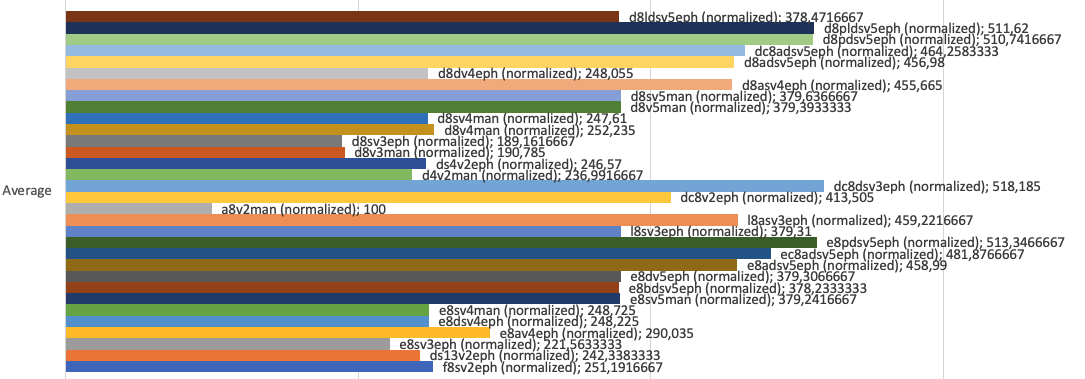
To address this, my benchmark suite additionally computes normalized scores that express the performance of each VM size, relative to the performance of the weakest VM size, which gets a normalized score of 100%. Normalization applies to each of the 6 tests separately.
The following gallery shows the normalized test scores:
And this gallery shows the multi-core performance gains:
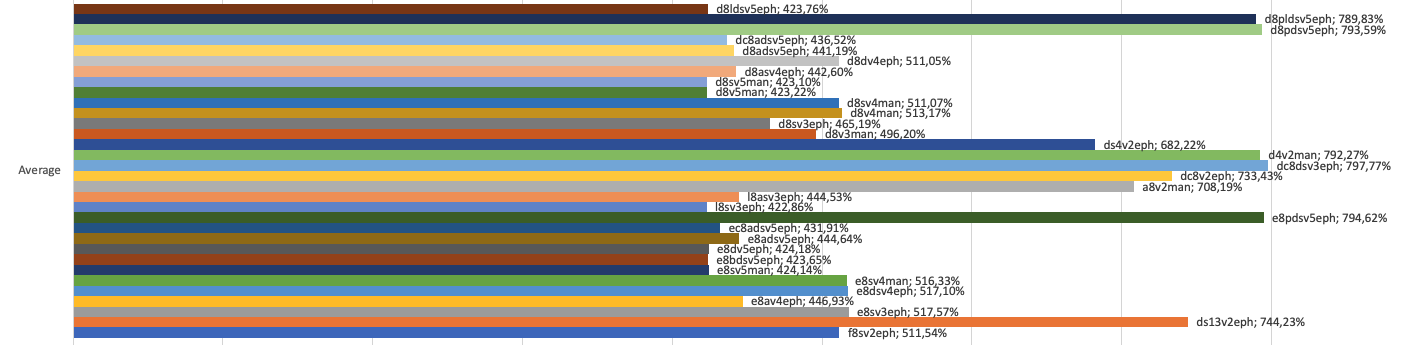
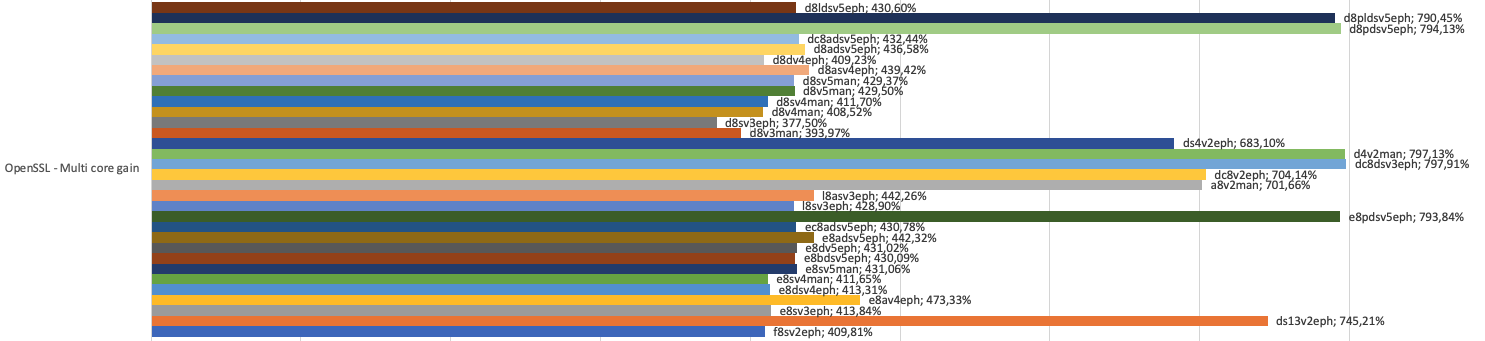
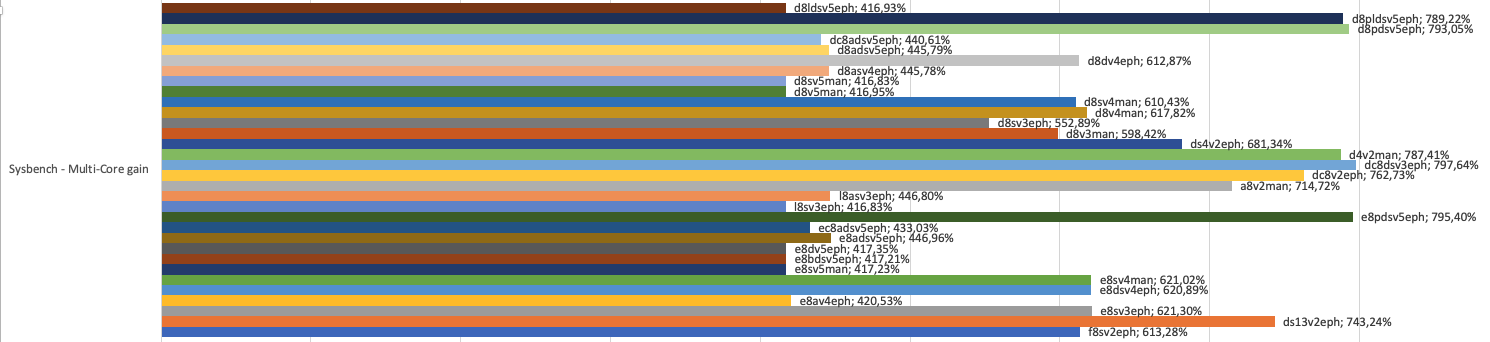
Let’s analyze the results:
- Overall best performance (averaging the scores of all single- and multi-core tests):
- The 3 ARM-based models (d8pldsv5eph, d8pdsv5eph, e8pdsv5eph) are in the top tier. As expected, they all have similar scores, because they all use the same ARM CPU model, but their RAM varies (16 vs. 32 vs. 64 GB). The Intel-based confidential computing VM size dc8dsv3eph is also in the top tier, but comes at double the price!
- As for the rest, sorted from well-performing to poor-performing: the AMD-based v5 instances (
e8adsv5eph,d8adsv5eph,dc8adsv5eph,ec8adsv5eph) come next, then the Intel-based v5 instances, then v4 instances, then v2, then v3. The a8v2man always comes last. - As expected, the CPU performance of VM sizes of the same generation (e.g. all Intel-based v5 instances) is almost equal.
- Best single-core performance:
- In the top tier you find the Intel or AMD-based DC8… and EC8… instances. Whether Intel- or AMD-based VMs are better depends on the concrete test.
- For the second place, the race is close between ARM and AMD-based v5 instances.
- Best multi-core performance:
- Depending on the test, the ARM-based instances or the DC/EC-based instances take the lead
- Next are the AMD-based v5 instances, then the Intel-based v5 instances
- Multi-core scalability (vs. single-core):
- ARM-based instances scale very well, with scores like 797% being very close to the theoretical 800% mark
- Surprisingly, VM sizes with poor absolute scores, such as a8v2, d4v2 and ds4v2, also have very good scalability (708%, 792%, and 682% respectively)
- The Intel-based confidential computing instances scale very well (dc8v2=733%, dc8dsv3=797%), but the AMD-ones do not (around 430%). This can be explained by the fact that the Intel-based DC instances provide real cores, while others treat each hyperthread as virtual core.
- As for all the other CPUs (Intel or AMD-based), broadly speaking the v5 instances are the best ones, but they also just reach about 430% scalability. However, such poor results are to be expected from virtual CPUs that treat hyperthreads as cores.
Another interesting analysis is the Price-Performance ratio, which is computed by dividing the average CPU score by the monthly price:
, sorted by PPR (descending). Also shows the monthly price in USD")
, sorted by ascending monthly price (shown in USD above each bar)")
As you can see, the d8pldsv5eph ARM-based VM size has the best score – simply because it is the “low memory” variant which is cheaper than the other ARM-based instances, which score second. I’d argue that third place goes to the d8asv4, d8adsv5 and dc8adsv5 VM sizes, which all have a roughly equal CPU score, but d8asv4 costs $30 less per month (but it only comes with 64 GB ephemeral OS storage, vs. the 300 GB offered by two v5 instances), so the right choice depends on your needs regarding the local disk’s size and speed.
Analysis of disk performance
The main finding is that ephemeral OS disk nodes perform much better than nodes that just have a managed disk. This matched my expectations, and the Azure docs also promise this speedup as a benefit.
Regarding ephemeral disks, we find the following:
- Some of the ephemeral disks performed much better than others. For instance, the sequential read/write MB/s of d8adsv5 or d8pldsv5 were about 785 MB/sec, while others, e.g. d8dv4, were about 478 MB/sec. I suspect that this is a temporary effect resulting from excess burst capacity available at those VMs during the time of the benchmark. Even though the benchmark tool, FIO, was configured to eliminate such kinds of systemic errors, by first putting load on the disk without counting the results for a while, I think the duration of that pre-load period was simply too short. The Azure docs specify that these ephemeral disks (of e.g. d8adsv5) should have an expected performance of 500 MB/s, so a value such as 478 MB/s does look quite realistic.
- As expected, the d8asv4 (AMD) or d8sv4 (Intel) performed worse than the v5 equivalents: the Azure docs confirm this observation: the v4 VM sizes only offer 400 MB/s throughput for the temporary disk, while v5 VM sizes offer 500 MB/s. There is a similar picture for the ephemeral OS disk IOPS: the ephemeral disks roughly deliver what is promised in the docs, and managed disks perform much worse than emphemeral disks, regarding IOPS.
- The storage-optimized VM sizes,
l8sv3ephandl8sv3eph, come with a very small (and slow) ephemeral local disk (80 GB, 80 MB/s according to Azure docs). The reason why you’d choose this VM size is that they have an additional very large and very fast NVMe disk (1.92 TB, 400000 IOPS, 2000 MB/s throughput). Due to technical limitations, my benchmark did not test the NVMe disk, but it is reasonable to assume that it would deliver the documented performance. My benchmarks confirm the documented 80 MB/s, however. Consequently, if you want to usel8sv3ephorl8sv3ephin your AKS cluster, make sure that you do not run them in ephemeral OS disk mode, but use a managed disk instead.
Looking closer at the managed disks, we find the following:
- The sequential read and write speeds (MB/s) of Standard SSD and Premium SSD seem to be almost the same, about 450 MB/s for reading and about 150 MB/s for writing.
- However, there is a large difference in IOPS for Standard SSD vs. Premium SSD: in the FIO Random Write test (4K block size), Premium SSD performed about 5x better than the Standard SSDs.
Arriving at a decision
While you can benchmark many different metrics (like disk speed, single-core performance, etc.), it is still not obvious how to choose the right hardware for you. To achieve your goal, you first need to determine which decision criteria there are, and how important each one is to you. Exemplary:
- Limiting criteria (which help you filter out unsuitable VM sizes from your benchmark), e.g.
- “We need at least 8 GB RAM per node, because our workloads require it”
- “We must use AMD/Intel-based nodes, because we run some proprietary software that is not yet available for ARM”
- Favorable criteria (“the more, the better”), built in such a way that each criterion uses the same scale (e.g. from 1-5 points), but each criterion may have a different weight. For instance:
- Relative CPU performance: you could e.g. use the average CPU benchmark results from the Excel sheet and renormalize them, such as that the weakest one (100%) corresponds to 1.0 points, the highest one (518%) corresponds to 5.0 points
- Choose a weight factor, e.g. 5 of 10
- Memory, e.g. 8 GB corresponds to 2 points, 16 GB to 3.5 points, 32 GB to 5 points
- Weight factor could be 3 of 10
- Disk speed, e.g. normalizing the disk throughput so that they range from 1.0 to 5.0 points
- Weight factor could be 2 of 10
- Relative CPU performance: you could e.g. use the average CPU benchmark results from the Excel sheet and renormalize them, such as that the weakest one (100%) corresponds to 1.0 points, the highest one (518%) corresponds to 5.0 points
This is essentially the normal “decision matrix” approach that is also explained by many other websites or books.
Feel free to extend the Excel sheet to compute such weighted scores.
Conclusion
Hardware benchmarking is a complex topic. It is often difficult to decide how much time and thought you should invest. Check out my benchmark series that looks into benchmarking in great detail. Part 3 of that series goes into detail of the benchmark suite I used in this article.