
This is a deep dive into PromQL, the Prometheus query language. I discuss the basic data formats (instant vector and range vector), explain the different types of operators and functions, and then elaborate on how binary operators do result vector matching. I conclude with various PromQL tips and hints, and help you get started in practice.
Kubernetes observability article series
This article is part of a series of blog posts about Kubernetes observability. You can find all other articles of the series here!
Introduction
The Prometheus stack is a popular set of tools used to achieve observability of your system. As indicated in the learning guide outlined in part I of this Observability article series, one important step (on the technical track) is to understand the Prometheus Query Language, PromQL. You need PromQL in two places: in Prometheus itself, to build alerting and recording rules, as well as Grafana, to select the data visualized in your dashboards. This article takes a detailed look at PromQL, the result data formats instant vector and range vector, the different operators, and how to match result data rows whose labels or sample count do not line up. Finally, I conclude with various tips and hints.
I recommend that you experiment and write your own PromQL queries while reading this article. In this previous article of this series I have already demonstrated different installation options. Once more, I highly recommend PromLens, which is a very helpful tool that visualizes and explains complex PromQL queries graphically. You can run it for free with a personal license on your own (non-commercial) infrastructure, or use a public live demo instance.
Refresher: time series vs. metrics
In this article, I will assume that you are aware of the difference between “time series” and “metric”. If not, please refer to my explanation here.
Result data formats
When you type PromQL queries into the query window (e.g. in Grafana, or Prometheus’ web interface on port 9090 of your Prometheus server), you get back 0 or more result rows. The result always has a type:
instant vector or range vector.
Instant vectors
Whenever you type something like some_metric_name or some_metric_name{some_label="value"}, the result is an instant vector. Consider the following example:
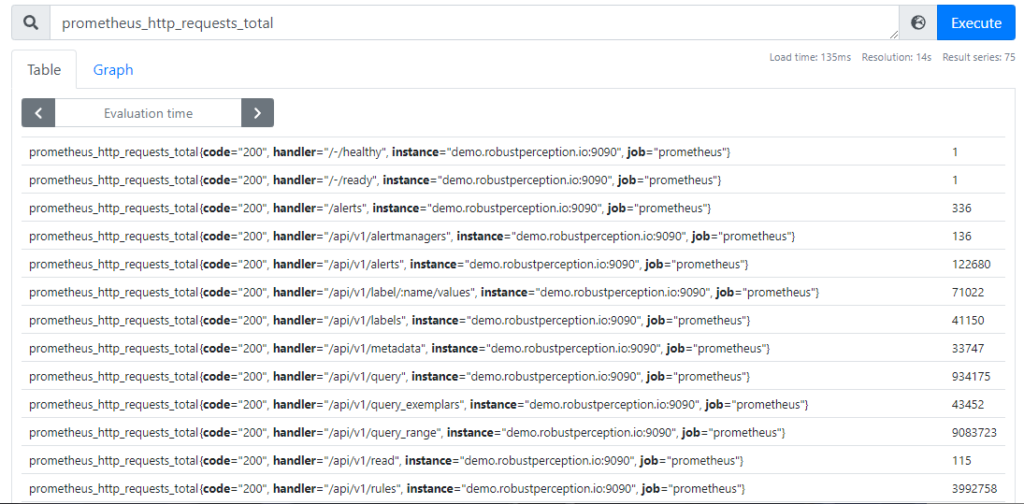
In this example, the result is an instant vector that contains ~100 time series rows, and each row contains the most recently scraped sample value for that time series. Note that the result does not contain the timestamp of when this sample was collected – it is assumed that it was collected recently. Prometheus actually discards samples that were collected more than 5 minutes ago, and corresponding time series rows would not be part of the returned result.
To help you remember it better: “instant vectors” have their name because the resulting rows only contain those time series with samples that were collected “at this instant” (usually a few seconds ago).
Range vectors
Queries such as some_metric_name[5m] or some_metric_name{some_label="value"}[5m] produce an result of type range vector.
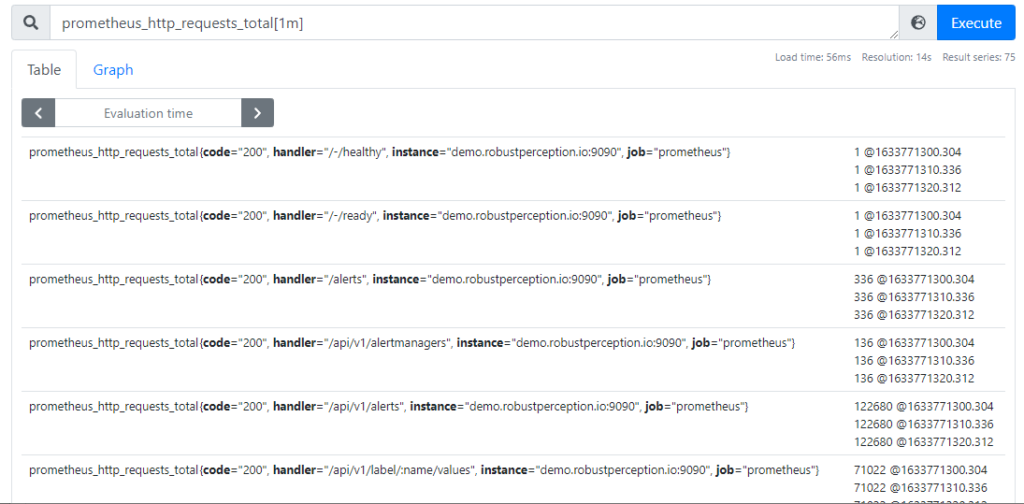
Range vectors are similar to instant vectors. As indicated by the above example, the there are two key differences between range vectors and instant vectors:
- A range vector contains multiple samples per time series – not just the most recently collected one
- The samples of a range vector are timestamped (the value after the @ character)
The part in angular brackets (e.g. [5m]) specifies the time window for which samples are returned. For instance, [5m] tells Prometheus to return samples scraped between “just now” and “up to 5 minutes in the past”. The available units are: s (seconds), m (minutes), h (hours), d (days), w (weeks), y (years).
Timing offsets
Sometimes you may want to query older data, e.g. to compare the request rates of “a week ago” with the current request rates. For this, PromQL offers the offset <duration> keyword that you can add at the end of a query. It works for both instant and range vectors!
For example, a query such as some_metric_name[5m] offset 1h will give you samples that were scraped between “1 hour ago” and “1 hour and 5 minutes ago”.
Operators
In practice, PromQL queries are rather large and complex. Often, they are compositions of several sub-queries, which you combine using operators, which is also a common technique in SQL queries. PromQL operators expect that their “input” is of the right data type (range vector, instant vector, or a scalar), which is why I explained the available data types in detail above. A scalar, by the way, is simply a floating point number.
Prometheus has three operator categories presented next: aggregation operators, binary operators, and functions.
Aggregation operators, such as sum / count / min / max / avg / stddev take a single instant vector as input and produce an instant vector as output. The result will usually have fewer time series (and labels) compared to the input instant vector, due to the aggregation.
The aggregation always happens over one (or more) label keys that you specify. There are two basic methods for specifying these labels. Let’s illustrate them by example, for the metric, node_filesystem_size_bytes, which has the label keys job, instance, device, mountpoint, fstype.
- Specify an allow list. Example query:
sum by(job, instance, device)(node_filesystem_size_bytes)- The resulting instant vector will only contain those labels whose keys you specified in the
by-clause, aggregating over all other labels. The example below make it obvious how the aggregation process works.
- The resulting instant vector will only contain those labels whose keys you specified in the
- Specify a deny list. Example query:
sum without(fstype, mountpoint)(node_filesystem_size_bytes)- The resulting instant vector will no longer contain those label keys that you specified in the
without-clause, but will contain all other labels the input instant vectors had. In this case:job, instance, device
- The resulting instant vector will no longer contain those label keys that you specified in the
When running either of the above queries (which both achieve the same thing, aggregating over fstype and mountpoint), aggregation works as follows:
Suppose the node_filesystem_size_bytes metric has the following instant vector time series:
node_filesystem_size_bytes{device="/dev/sda1",fstype="vfat",instance="localhost:9100",job="node",mountpoint="/boot/efi"} 100663296
node_filesystem_size_bytes{device="/dev/sda5",fstype="ext4",instance="localhost:9100",job="node",mountpoint="/"} 90131324928
node_filesystem_size_bytes{device="tmpfs",fstype="tmpfs",instance="localhost:9100",job="node",mountpoint="/run"} 826961920
node_filesystem_size_bytes{device="tmpfs",fstype="tmpfs",instance="localhost:9100",job="node",mountpoint="/run/lock"} 5242880
node_filesystem_size_bytes{device="tmpfs",fstype="tmpfs",instance="localhost:9100",job="node",mountpoint="/run/user/1000"} 826961920
node_filesystem_size_bytes{device="tmpfs",fstype="tmpfs",instance="localhost:9100",job="node",mountpoint="/run/user/119"} 826961920Code language: JavaScript (javascript)
Prometheus will internally create groups, where each group contains time series that have exactly the same labels (with equal label key and label value) for those label keys that shall remain in the final result. In this example:
# Group 1 {device="/dev/sda1",instance="localhost:9100",job="node"}
node_filesystem_size_bytes{device="/dev/sda1",fstype="vfat",instance="localhost:9100",job="node",mountpoint="/boot/efi"} 100663296

# Group 2{device="/dev/sda5",instance="localhost:9100",job="node"}
node_filesystem_size_bytes{device="/dev/sda5",fstype="ext4",instance="localhost:9100",job="node",mountpoint="/"} 90131324928

# Group 3 {device="tmpfs",instance="localhost:9100",job="node"}
node_filesystem_size_bytes{device="tmpfs",fstype="tmpfs",instance="localhost:9100",job="node",mountpoint="/run"} 826961920
node_filesystem_size_bytes{device="tmpfs",fstype="tmpfs",instance="localhost:9100",job="node",mountpoint="/run/lock"} 5242880
node_filesystem_size_bytes{device="tmpfs",fstype="tmpfs",instance="localhost:9100",job="node",mountpoint="/run/user/1000"} 826961920
node_filesystem_size_bytes{device="tmpfs",fstype="tmpfs",instance="localhost:9100",job="node",mountpoint="/run/user/119"} 826961920Code language: PHP (php)
The sum operator sums up the sample values within each of these groups, and returns one sample per group:
{device="/dev/sda1",instance="localhost:9100",job="node"} 100663296
{device="/dev/sda5",instance="localhost:9100",job="node"} 90131324928
{device="tmpfs",instance="localhost:9100",job="node"} 2486128640Code language: JavaScript (javascript)
Note: the result is no longer related to the (name of the) input metric! The name node_filesystem_size_bytes has disappeared, because the result is no longer resembling the original values measured by that metric name.
Binary operators are called that way because they take two input operands as input.
There are three types of binary operators:
- Arithmetic: + – * / ^ %
- Comparison: larger / smaller (or equal), equal, unequal
- Logical:
and,or,unless
Most binary operators take two instant vectors as input and produce an instant vector as output. But some operators also support a scalar to be one of the inputs, e.g. a query such as some_metric / 1024
While arithmetic operators are easy to understand and use, there are a few things to know about comparison and logical operators:
- Comparison binary operators:
- These operators are not changing the value (e.g. to true/false) in the result. Instead, they return samples of the input vector that is on the left side of the operator, filtering out those samples where the comparison result was
false. - If you don’t want samples to be filtered (i.e., missing from the result), but have them in the result with a value of
0, use theboolkeyword, e.g.some_metric > bool 10(instead ofsome_metric > 10). However, those samples for which the comparison evaluated totruewill then just have a value of1instead of the actually stored value. - For more details, see the official docs.
- These operators are not changing the value (e.g. to true/false) in the result. Instead, they return samples of the input vector that is on the left side of the operator, filtering out those samples where the comparison result was
- Logical binary operators:
andtakes the intersection of the data of the left and right side. It returns samples from the left side only if there are matching samples on the right side. This is useful in alerting, to specify more than one condition.orreturns samples from either side, preferring the data on the left side. In other words: samples from the left and right side are grouped (and Prometheus attempts to find matches). For each group the following holds: if there are samples in that group on the left side, return those, if not, return samples from the right sideunlessreturns samples from the left side, unless the right side has samples, in which case nothing is returned. This can be useful for alerting on conditions where you want to raise alerts if some metric is missing.- The
andandunlessoperator supporton(…)andignoring(…)(but theoroperator does not!) - There is no
notoperator. Use theabsent()function instead! Ifabsent()is called with an empty instant vector (i.e., a missing result), it returns a (usually label-free) instant vector with a single sample of value1. The returned result can have labels, e.g. when you callabsent(up{job="missing"}), it would return{job="missing"} 1.
When you compose nested sub-queries made of binary operators, it is not always clear which operators have higher priority. In Prometheus, the operator precedence (from high to low) is : ^ > * / % > == != < > >= <= > unless and > or
For instance, for a query such as some_metric * 2 ^ 3 Prometheus would first compute 2^3 (=8) and then multiply sample values of some_metric with 8, because ^ has the highest priority.
Functions take either instant vectors or range vectors as input, and usually produce instant vectors as result. There are a few exceptions which return scalars, e.g. time() and scalar().
There are dozens of functions, as indicated by the official docs, for all kinds of purposes, e.g. mathematical functions or date/time-related functions. Explaining them all would take many blog posts.
Instead I’d just like to explain one function, rate(), which you will need very often in your PromQL queries, and which is particularly poorly explained by the official docs. rate() expects a range vector of a metric of type counter. Because the sample values of counters are monotonically increasing, they are not useful for graphing, or in a alerting query in that raw form – you would not know what value to compare them against. The rate() function helps you here, because it “flattens” this monotonically increasing flood of values by computing the delta of your sample values over a defined time period, and it normalizes the delta value so that it is “per second”.
An example is very helpful to understand this better. Suppose the range vector of process_cpu_seconds_total[5m] returns the following samples (only showing samples for one specific time series with labels instance="demo.robustperception.io:9090", job="prometheus"):
4858038.33 @1633506420.307
4858045.41 @1633506430.304
... 24 more samples, omitted for brevity ...
4858214.65 @1633506680.311
4858221.63 @1633506690.312Code language: CSS (css)
What rate() conceptually does is to compute this:(latest value - oldest value) / (latest timestamp - oldest timestamp)
I.e., we divide the sample value delta (here 4858221.63 – 4858038.33 = 183.3 CPU seconds) by the timestamp delta (1633506690.312 – 1633506420.307 = 270 seconds), which results in a per-second rate of ~0.68. The time window we specified (here: [5m]) specifies how strong the averaging/smoothing effect is – the larger the time window, the stronger values are averaged.
In reality, the algorithm is much more complex. rate() intelligently accounts for missing sample values, and also handles counter resets (where scraped sample values are decreasing, because the exporting application crashed/restarted).
When you use rate() in a graph that draws rate(some_metric[...]) as a line, then, conceptually, each pixel of that line is created by calling rate() separately, offsetting the time window by a few seconds each time. In reality, of course, there are much more efficient APIs where a single call will produce the array of rate() values the graph needs.
A few tips regarding rate():
- The time window (e.g.
[5m]) that you provide torate()should be at least 4 times as large as the scrape interval configured for the target that provides the respective metric. - When you combine
rate()withsum(), always callsum by(...)(rate(<counter-type metric>)), never the other way around, because then you would be summing raw counter sample values, which is meaningless.
Vector matching
When a binary operator is given two instant vectors as input, it has to match the time series rows of the left side of the operator with the rows of the right side. This is known as vector matching. There may be a disparity considering either the labels, or the (number of) samples, or both.
If you are lucky, the labels and sample count match exactly one-to-one, in which case you don’t have to do anything special – your PromQL query can simply be <left expression> <operator> <right expression>. Prometheus can match the samples to the respective other samples, where the labels match.
However, this is often not the case, and you can tell from the fact that something is wrong with matching, if the result of a binary operator query is an empty instant vector. Fortunately, there are mechanisms you can use to handle these issues:
- To deal with label mismatches, you can use the keywords
ignoringoron, which work very similar to how the keywordswithoutorbywork for aggregation operators.- Concrete example:
sum without(cpu)(rate(node_cpu_seconds_total{mode="idle"}[5m]))/ ignoring(mode)sum without(mode, cpu)(rate(node_cpu_seconds_total[5m])) - I highly recommend that you open the PromLens demo and run the above query. By clicking on the different nodes in PromLens you can easily understand what the (intermediate) results are. It becomes obvious that a query such as
sum without(cpu)(...) / sum without(mode, cpu)(...)
(i.e., omitting theignoring(mode)part) would not have worked (no error would be shown, but you would have gotten an empty instant vector as result), because the result of the firstsumoperator has the labelsinstance, job, node, but the secondsumoperator result has only labelsinstance, job. - As you can see, the keyword (
ignoring, oron) must be placed immediately to the right of the binary operator.
- Concrete example:
- If the labels match (or you made them match using above
ignoring()trick), but the number of samples / result rows don’t, you’d get an error message, such as “multiple matches for labels: many-to-one matching must be explicit (group_left/group_right)“, because you have a many-to-one (rows) matching situation. This could e.g. happen if you take the above example and get rid of the{mode="idle"}part. Just try it in PromLens! You will see that the the first sum result now has many time series (one for each CPU mode), but the second sum still only has one time series row.- PromQL does support many-to-one matchings, but you have to explicitly tell Prometheus that this is what you want, by adding the
group_leftkeyword to the right of the binary operator. If you already haveignoring(…)oron(…)there,group_leftmust come after it). Thus, the syntax is:<left expression> <operator> [ignoring(labels) | on(labels)] group_left <right expression>
- Essentially,
group_leftorgroup_rightinstructs Prometheus to duplicate the result rows / samples on the respective other side of the operator, so that you get a one-to-one matching between the samples of both sides again. In our example, we should usegroup_left, because the right side of the operator is the side that has fewer time series rows (which need to be duplicated). - There is also a
group_rightkeyword, which is likegroup_left, but works in the opposite direction. - By using the syntax
group_left(label1,label2,…)(instead of justgroup_left) the final result will not only contain the labels present in the results of the left side of the operator, but Prometheus will also copy the specified labels (here:label1andlabel2) of the right side of the operator into the result. A typical use case is to enrich the results with values from another metric, e.g.up * on(instance) group_left(version) prometheus_build_info
which enriches theupmetric (having theinstanceandjoblabels) with theversionlabel of theprometheus_build_infometric.
- Note: Prometheus does not support many-to-many matchings, only one-to-one or many-to-one or one-to-many!
- PromQL does support many-to-one matchings, but you have to explicitly tell Prometheus that this is what you want, by adding the
PromQL tips and hints
Metric name syntactic sugar
In PromQL, something like metric_name{key="value"} is just syntactic sugar for {__name__="metric_name",key="value"}
Avoid using empty selectors
When writing a query, you either have to omit the selector (e.g. some_metric), or specify at least one label in the selector (e.g. some_metric{key="value"}, where the curly-braces part is the selector). You cannot just use an empty selector – something like some_metric{} or even just {} is not allowed, because this might overload the Prometheus server, and there is a safety measure in place which avoids this overload.
Another rule is that you must have at least one matcher in a selector that has a value different to the empty string. For instance, queries such as {foo=""}, {foo!=""}, and {foo=~".*"} would return an error, because they all just use (or would match) an empty string as value in the matchers!
Get a list of all (or specific) time series stored in Prometheus
Use a query such as {__name__=~".+"} to get a list of all time series stored on the server.
Something like {__name__=~"foo.*"} retrieves the list of those time series starting with foo.
In case you are not familiar with regular expressions: the . stands for the character class (match any character) and the + suffix stands for “at least once”, thus the two characters .+ together tell Prometheus to match any metric whose name consists of at least one character.
Aggregation operators: by vs. without
When using aggregation operators, you should usually prefer the use of
<aggregation operator e.g. sum> without(label1,label2)(...)
over
<aggregation operator e.g. sum> by(somelabel)(...)
Why? Because the labels of time series are not always stable over time. Labels are typically either instrumentation labels (which usually don’t change) or target labels (attached by Prometheus during a scrape). Target labels are very dynamic, and are often not under the control of the person writing a PromQL query. Consequently, it is better to use without aggregations (where you aggregate over the definitely-known labels, which removes them from the result), leaving the resulting instant/range vector with all the other labels. This approach lets the query-author notice when suddenly new labels pop up (e.g. in a dashboard or alert notification) and they can then tweak the PromQL query, if needed. Using without is especially important for alerting rules, to preserve all the other labels in the alert notifications.
The by aggregation can still be useful in some cases, e.g. when aggregating over an info metric (whose instrumentation labels are expected to change more often), e.g. a query such as count by(release)(node_uname_info)
Alerting rule tips
- If you want an alert to only fire during a certain time, write something like:
<alert rule> and on() hour() > 9 < 17- The
on()makes sure that instant vector matching still happens, even though the output of the statements that are left and right ofandhave no labels in common. - Instead of
hour(), you can also use other functions, e.g.minute, day_of_week, day_of_month, month, year
- The
- In your
alert-rules.ymlfile, use at leastfor: 5m, to avoid false positives. You cannot react much faster anyway!- Caveat to be aware of: Prometheus does not persist the state of
forto disk (but only keeps it in RAM), so when you restart Prometheus, it starts the evaluation from scratch!
- Caveat to be aware of: Prometheus does not persist the state of
- Important caveat:
forexpects that every single evaluation of that alert rule contains non-stale results.
Suppose you had a rule withexpr: process_open_fds > process_max_fds * .8andfor: 5m.
If only a single scrape of theprocess_open_fdsmetric fails, the evaluation of that expression will yield an empty result (because of the staleness marker), and theforstate will be reset. See here for more details about staleness. The workaround is to use functions such asavg_over_time, max_over_time, e.g. adapting the above example tomax_over_time(process_open_fds[5m]) > max_over_time(process_max_fds[5m]) * .8- Note: the
upmetric is a special case – here this gotcha does not apply, becauseupis present even if a scrape fails!
- Note: the
- You can use the
amtool check-configcommand to validate youralertmanager.ymlconfig file, e.g. prior to committing to version control.
Conclusion: putting PromQL queries to practice
PromQL queries are primarily used to write alerting rules, and to build Grafana dashboards. The main difficulty with PromQL is the huge amount of available metrics. For instance, the /metrics endpoint of Prometheus itself already has over 150 metrics, the node exporter can easily have over 250 metrics, and other exporters (or your own application) will have many more. It would be a daunting task to scan all these metrics to decide which ones to use in your dashboards or alerting rules.
Fortunately, the Prometheus and Grafana community has already done a lot of the work for you:
- For Grafana dashboards there is the official Dashboard repository, where a search for some third-party exporter (e.g. “postgres”, “node exporter”, etc.) will give you plenty of dashboards you can use as a foundation.
- For alerting rules, there are sites such as Awesome Prometheus alerts, which contain many examples for various exporters. Not all of them are really sensible: you still need to evaluate each rule, whether it makes sense for your system.
These resources will help you get started, because you no longer need to start writing queries from scratch. Instead, you adapt them to your needs, using your understanding of operators, functions, etc. provided in this article.