This article takes a detailed look at the architecture of the Prometheus stack, consisting of the individual applications Prometheus, Alertmanager, Grafana, Pushgateway, and various exporters. I discuss how each component is configured, which kind of data it stores, and how Prometheus can be scaled.
Kubernetes observability article series
This article is part of a series of blog posts about Kubernetes observability. You can find all other articles of the series here!
Introduction to Prometheus
The Prometheus stack is a popular set of tools used to achieve observability of your system. As indicated in the learning guide outlined in part I of this Observability article series, the first step (on the technical track) is to understand the architecture of this stack, and how the different tools fit together. This article takes a detailed look at the architecture, explains the rationale behind it, how the individual components are configured, and also explains how Prometheus can scale.
Architecture high-level overview
The Prometheus stack consists of many separate programs / applications, which all have a dedicated responsibility. They all communicate with each other via HTTP to achieve their overall goal: observability of your (possibly large-scale) distributed system. The team behind Prometheus chose this separation-of-concerns-approach so that each program can be configured and deployed separately (on different machines, if necessary). It also reduces the complexity of each individual program. Let’s take a look at the Prometheus architecture diagram of the official documentation:
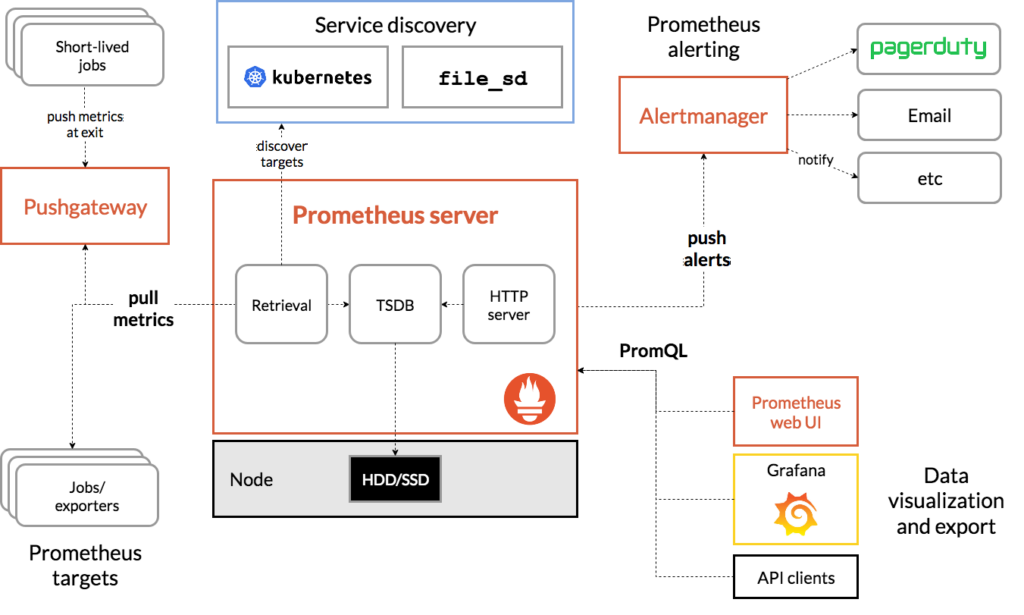
At the heart we have the Prometheus server, which has several sub-systems, most notably the TSDB, the retrieval component, and a HTTP server. The TSDB is a persistent, disk-based Time Series Database. The retrieval component regularly pulls “metric data” from other applications that expose these metrics (via HTTP), e.g. every 15 seconds, and stores them in the TSDB. This regularly pulling is also called “scraping”. The Prometheus HTTP server offers a REST endpoint that allows other systems, such as Grafana, to query stored metrics data.
Where do metrics come from, you ask? There are two basic types of applications that expose metrics:
- Your own application, for which you implement a
/metricsHTTP endpoint offering these metrics. The Prometheus community has built SDKs simplifying this task, for all common programming languages. - A third-party exporter. An exporter is an application which scrapes metrics from a third-party system (e.g. a database server, or the host’s operating system kernel) using that system’s proprietary APIs, and converts the obtained metrics to the Prometheus metrics format, also exposing them on the
/metricsendpoint. The third-party system itself is not aware that it is being observed. There are hundreds of ready-to-use exporters, see here and here! The most famous one is node exporter, which extracts metrics from a compute node, e.g. the usage of memory, storage, networking and CPUs. Another important one is cAdvisor, which exports resource usage and performance characteristics of running Docker containers.
Back to scraping. At the end of each scrape loop, Prometheus evaluates alert rules on the metrics stored so far. You write these alert rules using Prometheus’ query language, PromQL. An example for an alert rule might be “disk usage of any disk on any node has exceeded 90%”. If any of the configured alert rules are triggered, Prometheus generates an alert and pushes it to the Alertmanager application. Note that the alert is just a (JSON) object, no emails, pager messages, etc. have been sent yet! When the Alertmanager receives the alert, it stores it in its internal database. The Alertmanager deduplicates and groups the alerts (to reduce spam), using a configuration you provided. It then generates alert notifications, i.e., it routes alerts to the correct receiver, such as email, or PagerDuty.
There are two more boxes in the architecture diagram that require an explanation:
- Pushgateway & short-lived jobs: if you want Prometheus to collect metrics of an application or job (e.g. a cron job) that has a very short life span (that is shorter than Prometheus’ scrape interval), you’d have a problem: the application (and its
/metricsHTTP endpoint) might not be alive when Prometheus attempts to scrape it. To circumvent this problem, you run a tool such as Pushgateway, which is a permanently-running metrics cache that short-lived jobs can push metrics to. Prometheus then scrapes these cached metrics from the Pushgateway’s/metricsendpoint. - Service discovery: Prometheus was built for monitoring large, horizontally-scaled distributed systems. They consist of many (compute) nodes and service instances, which come and go all the time, e.g. due to elastic scaling. For such systems, it would be an unmanageable burden to manually configure a static list of hosts / targets that the Retrieval component of Prometheus should scrape. The Service discovery (SD) mechanism of Prometheus implements a dynamic discovery mechanism, with many concrete implementations already available, that discovers scrape targets dynamically. For instance, SD can detect services and nodes in Kubernetes, or Consul (for a list of implementations, see the
..._sd_configblocks in the official docs).
From the official architecture diagram I extracted the following, more detailed architecture diagram:

It should help you understand the sub-components of the different applications. Let’s look at the data flow once again:
- The Retrieval component of Prometheus regularly polls metrics from
/metricendpoints offered by applications, exporters, or even Prometheus’ own exported metrics. The metrics are stored in Prometheus’ (embedded) TSDB, with the current scraping timestamp being added to the data. - Whenever the Alert rule evaluator component of Prometheus detects that some of its configured alert rules are triggered (which it determines by querying the TSDB), it generates an alert object and sends it to the Alertmanager.
- The Alertmanager stores the received alert object in its own (embedded) database, also doing deduplication.
- The Notification pipeline of the Alertmanager regularly evaluates the alerts stored in the database (according to the configured alert routing tree, more details below), and sends alert notifications to the configured receivers, when applicable. “Receivers” does not refer to “people”, but systems which then actually notify people (email, Slack, etc.)
The above diagram also demonstrates which artifacts are used for configuring the applications (files, database, or both), so let’s dive deeper into the configuration aspects.
Configuration
Each application (Prometheus, Alertmanager, Grafana, Exporters) has a different configuration approach, as summarized by the following table:
| Configuration approach | Persisted stateful data | |
|---|---|---|
| Prometheus | Stateless (files) | Metrics |
| Alertmanager | Stateless (files) | Alerts, silences |
| Grafana | Stateful + Stateless (provisioning mechanism) | Grafana configuration |
| Exporter | Usually stateless (files), depends on exporter | — |
Meaning of the columns:
- Configuration approach: stateless means that the application does not (statefully) store any configuration values internally, e.g. in a database. Instead, configuration is typically provided via files (e.g. formatted as YAML or JSON). These files are meant to be under version control, e.g. in Git.
- The upsides of the stateless approach are:
- The configuration is always explicitly changed by you inside these file (single source of truth)
- Moving the instance of the application from one node to another is easier, because only a few files need to be mounted (vs. having to extract and transfer state)
- Changes made to the configuration are traceable (via Git)
- Configuration files are human- and machine-readable
- The downsides are:
- You cannot dynamically adapt the configuration, e.g. via API calls
- Compared to a GUI, changing the configuration via text is less convenient and error-prone (mistakes do wreck your monitoring system)
- The upsides of the stateless approach are:
- Persisted stateful data: indicates whether the application has an internal (stateful) data store, and if so, which kind of data is stored inside it.
Let’s examine each application more closely.
Prometheus
Prometheus is stateful regarding the collected metrics (stored in the TSDB), but is stateless regarding the configuration. Consequently, you cannot change the configuration via the Prometheus web interface, or API. However, there are third-party projects such as prometheus-configmanager which make this possible, by providing a configuration API.
Configuration is done via multiple files, most notably these:
prometheus.yml
global:
  scrape_interval: 15s
  evaluation_interval: 15s

rule_files:
  - "alert-rules.yml"

scrape_configs:
  - job_name: 'nodeexporter'
    scrape_interval: 5s
    static_configs:
      - targets: [ 'nodeexporter:9100' ]
  - job_name: 'cadvisor'
    scrape_interval: 5s
    static_configs:
      - targets: [ 'cadvisor:8080' ]

  - job_name: 'prometheus'
    scrape_interval: 10s
    static_configs:
      - targets: [ 'localhost:9090' ]

alerting:
  alertmanagers:
    - scheme: http
      static_configs:
        - targets:
            - 'alertmanager:9093'
Code language: YAML (yaml)- Specifies which alert-rule yaml files to consider (see
rule_filessection) - Specifies
globalconfiguration parameters, such as the scrape interval, or which Alertmanager instance(s) to send alerts to (specifying theirhostname:portin thealertingsection) scrape_configs: Specifies a list of scrape jobs. Each job has a name (such that something likejob_name: 'nodeexporter'in theprometheus.ymlwill cause Prometheus to add a label such asjob: 'nodeexporter'to the scraped metric when storing it in its TSDB) and one or more targets in the form ofIP:port+path). Typical entries in thescrape_configsarray are the Prometheus server itself, Alertmanager, cAdvisor, nodeexporter, Pushgateway, and other custom exporters. For each target, you can either use astatic_config(where you just manually provide the host, port and metrics URL to query), or use one of many dynamic service discovery (sd) options, e.g.kubernetes_sd_configoropenstack_sd_config.
alert-rules.yml
groups:
  - name: group1
    rules:
      - alert: alert-name-1
        expr: up == 0
        for: 30s
        labels: # labels to attach to alerts
          severity: critical
        annotations:
          summary: "Some monitoring-related service is non-operational"
          description: "Service {{ $labels.instance }} ({{ $labels.job }}) is down."

  - name: group2
    rules:
      - alert: SomeHttpServicesAreDown
        expr: probe_success == 0
        for: 10m
        labels:
          severity: critical
        annotations:
          summary: "Some HTTP service is non-operational"
          description: "Service {{ $labels.instance }} ({{ $labels.job }}) is down."
Code language: YAML (yaml)- Here you define recording rules or alerting rules.
- Recording rules allow you to pre-compute computationally expensive metrics data (from incoming raw metrics) which you need frequently, and save the computed result as a new set of metrics. This is useful for dashboard software (such as Grafana) which query the same (expensive-to-compute) metrics data repeatedly every time they refresh.
- Alerting rules are rules that tell Prometheus when it should send alerts to the Alertmanager.
- The
alert-rules.ymlfile starts with agroups:section, in which you specify one or more groups. For each group you define one or morerules. Apart from these rules, you give each group a name, and an optional custom interval (at which the evaluation takes place). You can think of each group being executed in parallel, by a separate thread. The rules within a group are all sequentially evaluated. - For each alerting
ruleyou define a name (alert: foo), a PromQLexpression, the duration (to filter noisy alerts, e.g.for: 30s), and optionally add labels or annotations which Prometheus will attach to alerts when they fire:- labels could e.g. contain the severity level
- annotations typically include a
summaryand adescription. - You can use variables in your labels and annotations (templating)
Alertmanager
Like Prometheus, Alertmanager is partially stateful (storing received alerts and silences), but also partially stateless, as it is also configured using files.
config.yml
global:
  smtp_smarthost: smtp.example.org:587

route:
  receiver: 'default-receiver'
  group_wait: 30s
  group_interval: 5m
  repeat_interval: 4h
  group_by: [ cluster, alertname ]
  # Note: this root "route" node may not have any "matchers"! All incoming alerts must match the root
  routes:
    - receiver: 'database-pager'
      group_wait: 10s
      matchers:
        - service=~"mysql|cassandra"
    - receiver: 'frontend-pager'
      group_by: [ product, environment ]
      matchers:
        - team="frontend"

receivers:
  - name: 'default-receiver'
    email_configs:
      - send_resolved: true
        to: some.receiver@mail.com
        from: no-reply@host.com
  - name: 'database-pager'
    ...
  - name: 'frontend-pager'
    ...

inhibit_rules:
  [ - <inhibit_rule> ... ]
Code language: YAML (yaml)globalsettings, such as receiver-specific global values (used to get rid of redundancy of configuration values which would otherwise have to be copied to different places in theconfig.ymlfile)receiversconfigures receivers (e.g. an SMTP service or web hook) and their credentialsroute: a route is a recursive data structure, thus forming a routing tree. The basic idea is that alerts traverse down the alert routing tree, based onmatchersthat match labels of the received alerts. If an alert does not match any children of aroutenode (because nomatchersof the child nodes match, or because there are no child nodes), the alert is handled by the current node. In general,routenodes inherit values from their parent node. Eachroutenode has the following configuration parameters:matchers: only the alerts having the specified labels/values (or regular expression of a value) will continue down this branch of the treegroup_by: a list of label keys by which to group alerts. Alertmanager then creates one group per label value. This avoids that your developers / operators are spammed with alert notifications.- Various waiting periods or intervals, to reduce the number of sent alert notifications
receiver: the name of the receiver to which the alert notification should be sentroutes: an array ofroutechild objects
inhibit_rules: an array ofinhibit_ruleobjects. Allows muting a set of alerts because another alert is already firing. This reduces alert (notification) spam. For instance, if you detect that an entire node is down, you don’t need 10 more alert notifications for the 10 services running on that node (which are consequently also down).
Grafana
Grafana does not store any metrics data, but always retrieves it from Prometheus at run-time. The configuration of Grafana (e.g. data sources, users & authentication, or dashboards), however, is statefully stored in Grafana’s internal database. They can be manipulated via Grafana’s REST API, or its web interface. However, Grafana also has a provisioning mechanism that lets you overwrite the internally-stored configuration via files when Grafana starts, and in regular intervals (whenever Grafana detected a change in file contents).
Exporters
Because Prometheus expects exporters to only expose metrics data of the application for the time of the scrape (in other words, Prometheus does not expect historic metrics data), exporters are typically completely stateless.
The configuration approach highly depends on the application and exporter. Some exporters don’t require any configuration, but most typically, stateless CLI arguments and/or environment variables are used to configure the exporter.
Caveats of pull-based monitoring
Prometheus uses a pull-based approach, where the Prometheus server collects / pulls metrics from endpoints, the list of which Prometheus has to determine via static and dynamic service discovery. Other systems, such as Graphite, instead use a push-based approach, where the agents need to know the collector, and push metrics data to it.
If you search for “push vs pull monitoring”, you will find wildly different views about which one is “better”. Most of these articles are written by tool manufacturers who then justify why their approach is the “slightly superior” approach, because of some optimizations they applied, or because they were able to debunk some myth about their approach being bad, etc. In the end, push- and pull-based systems both have disadvantages, but the severity (of disadvantages) depends on your concrete use case.
With any monitoring system you will need to handle details such as:
- Latency: the lag between “metric data point is known” and “monitoring system has processed it”. Some authors argue that push-based system offer lower latency, and are therefore superior to pull-based systems. They conveniently forget (?) to mention that saving these few seconds is irrelevant in practice, because:
- a) your team will take many minutes or even hours to actually diagnose and fix the problem,
- b) you typically apply aggressive sliding window averaging (to get rid of outliers and false positives) on your server / collector, with window sizes that are much larger than the latency you reduced by using a push-based system.
- Discovery: there is always complexity involved in making the agent instances aware of the collector / server instances (or vice versa). There is no free lunch…
- Security: the ease of implementing mechanisms (and their degree of safety) which ensure that no unauthorized party may access metrics data (of the agents or collector)
- Scalability: once you have many agents producing a lot of data, neither approach would work well, using just a single collector server. Most implementations have solutions for scaling. See below for Prometheus’ scaling approach.
- Operational complexity: involves firewall configurations, and how easy it is to change the configuration of the entire monitoring system
In practice, you will probably do fine with either approach. And architecturally-speaking, you can mix&match the pull- with push-based approach. For instance, the Pushgateway is converting push to pull, and applications such as Telegraf can convert pull to push.
Prometheus’ pull-based approach does have two disadvantages (of category operational complexity) which I’d like to address:
- Monitoring multi-process applications: it is challenging to pull metrics from the
/metricsendpoint of your application if you use multiple processes. The reason is that metrics data is typically only kept in memory, separately for each process, and it is unclear which of your processes actually serves the/metricsendpoint, and how metrics data is accumulated. Suppose you are building a Python web app (e.g. with Django or Flask) and use a WSGI application server for scalability, such as Gunicorn or uWSGI, which run multiple worker processes:- Solution approach #1: let each process collect its own metrics, and whenever
/metricsis called, the Prometheus client library uses some inter-process communication to collect the aggregated metrics from all processes (e.g. using files under the hood). For an implementation example, see the multi-process mode for Prometheus’ Python library. - Solution approach #2: treat each worker process as if it was a separate application, i.e., each worker is known as a separate target to Prometheus, and each worker has its own
/metricsendpoint, e.g. under a different port. Aggregation of metrics is delayed and performed in PromQL on the server at query time. See here for an example. - Solution approach #3: Let the workers push the metrics to an aggregator (e.g. Pushgateway or statsd), from which Prometheus pulls the aggregated metrics. See e.g. here.
- Solution approach #1: let each process collect its own metrics, and whenever
- Monitoring short-lived processes: processes, such as backup scripts, may not be alive long enough to serve a metrics scrape. Here, only the push-based approach makes sense. The solution is to mix push- and pull-based approaches, and use something like a Pushgateway (see solution approach #3 above).
Scaling Prometheus
By now, you might be wondering: if the Prometheus stack is designed to do observability of a large-scale distributed system (with potentially thousands of nodes and services), how does Prometheus itself scale, including its related components, such as Alertmanager? Clearly, running just a single instance of Prometheus and Alertmanager is dangerous. You would risk the system’s high availability (if the one server crashes, you’d lose observability completely), and risk the system’s performance (when Prometheus cannot keep up with collecting all that metrics data).
Interestingly, the Alertmanager offers an High-Availability-mode (where a gossip protocol between the Alertmanager instances exchanges information about notifications and silences), but Prometheus does not! From a performance standpoint, often case a single Prometheus is enough. Its implementation is very efficient, being able to scrape thousands of servers (where each server has thousands of metrics data streams). If you still choose to scale Prometheus horizontally, you simply run multiple Prometheus servers, which scrape data independently from each other. You should make all of your Alertmanager instances known to your Prometheus servers, so that they send the alerts to all of them. The gossip protocol of the Alertmanagers will make sure to deduplicate notifications.
If you operate multiple Prometheus servers, you don’t have to configure them all to scrape the exact same targets. This would only achieve high availability, but performance would still not suffice if you have many targets. Instead, you let different Prometheus servers scrape different targets, and then have yet another “leader” Prometheus who scrapes the other Prometheuses. This concept is called “federation”. As documented here, Prometheus has a /federate endpoint. You can configure a Prometheus to scrape other Prometheuses’ /federate endpoint. A typical use case is a 2-level hierarchy, where you have several Prometheus servers (e.g. one in each data center) on level 1, and one (or more, for HA) global or “leader” Prometheus servers on level 2, scraping the level 1 ones. The global Prometheus then lets you do calculations such as “how much global traffic did our application receive?”. See this article to find more about scaling and federation.
Finally, you need to solve the issue of scaling storage. Each Prometheus expects access to a fast storage system (often a local SSD, or some kind of fast NAS). Data is kept only for a short time period by default, such as two weeks, to keep the disk consumption manageable. If you want long-term metrics storage, the amount of data would grow beyond what typical disks could handle. Thus, you are stepping into the realm of distributed storage. There are solutions such as Thanos, Cortex and M3 which offer solutions for long-term storage, including load-balanced query endpoints. Take a look at the presentation “When Prometheus Can’t Take the Load Anymore” (video, slides) from May 2021 to learn about their differences.
Conclusion
The Prometheus stack is a complex system. In my opinion, separating the stack into multiple applications (where each one has a separate concern) has been a good approach. You will quickly get used to the way this affects configuration of the components, understanding which part of the configuration belongs into what file. The fact that you now have many (smaller) files (stored in version control) helps larger teams to split responsibilities, regarding who configures what.
The next article
, takes a look at basic concepts of the Prometheus stack in more detail, refining some of the concepts already introduced here.