PlantUML is one of the most feature-complete tools that lets you create diagrams as code, using plain text. It supports UML diagrams and beyond, and has a large ecosystem. In this basic PlantUML tutorial I present an introduction on what PlantUML is and how to learn it. I go into detail about the very useful PlantUML standard library, approaches to work with images, and how to integrate your diagrams into your existing documentation.
Introduction
In a previous article I discussed several markup languages, such as Pichr, Mermaid and PlantUML, which let you write diagrams as code, as plain text files. In this article and a follow-up post (which I will release in two weeks) I take a detailed look at PlantUML. Compared to other markup languages, PlantUML offers the most features, is still actively developed, has a very active forum community and has established a large ecosystem of tools, including real-time preview plug-ins for your favorite IDE.
I chose to write this article because the official documentation is somewhat chaotic. This article provides an understandable introduction, with basic examples. I go into further details here and here.
Diagrams beyond UML
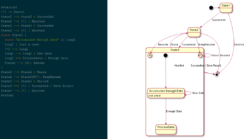
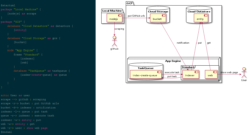
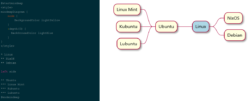
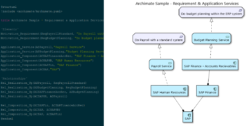
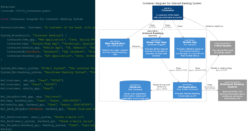
As the name implies, PlantUML may have originally been designed to create UML diagrams. However, PlantUML can create many other kinds of diagrams, as the following gallery illustrates:
You can download the snippets as text here.
How PlantUML works
PlantUML is a Java application, packaged as a jar file. It converts your diagram files (which typically have the .puml extension) to rasterized graphics like png/jpg, or vector graphics like eps/svg files. Internally, PlantUML uses Graphviz to determine the node layout, but PlantUML does not offer a Graphviz export as dot files (see here). PlantUML offers a few other export formats, such as PDF (for which you need additional jar files, see here), ASCII art text, or Tikz/LaTeX.
To render images locally on your machine, you will need Java, the PlantUML jar file, and Graphviz. I recommend that you consult the official manual for installation instructions. On Windows, recent PlantUML versions come with an embedded Graphviz binary, which facilitates the installation a bit.
Fortunately, you can get started quickly, without installing anything. Using remote rendering, others provide an API to which you send your diagram code, they render the image on the server and return it back to you. Such services are free to use, either from an IDE plug-in, or from a web-based editor.
Choosing your editor
If you are just starting out, I recommend a web-based editor. There is an official one offered by PlantUML.com, but there are better choices, such as kkeisuke, LiveUML, or PlantText. The latter ones offer a better user interface, including templates and cheat sheets.
If you are looking for a local tool and have no IDE preference, consider using VS Code with the PlantUML extension, because it runs very smoothly. Simply start by opening a new folder in VS Code, create a new file with .puml extension, and write some PlantUML markup. To get live preview, in the file’s editor window, do a right-click and choose Preview Current Diagram.
Consult the official list of tools and integration for further tools, or just search the Internet for “<your IDE name> plantuml” to find a suitable plug-in.
Basics
Choosing the diagram type
PlantUML supports all kinds of diagrams, as the links at the top of plantuml.com illustrate. The first and last line of your diagram file tells the PlantUML engine which kind of diagram you want to create. For instance, your file could start with @startmindmap and end with @endmindmap, which indicates a mind map. At the time of writing, there is @startwbs (work breakdown structure), @startmindmap, @startgantt, @startsalt (for UI mock-up diagrams), and of course @startuml. Interestingly, for @startuml, you do not explicitly specify which kind of UML diagram you want, such as activity, sequence, or class diagram. PlantUML automatically infers the diagram type, by the markup you put into your diagram. For instance, if you include class Xyz then the diagram will be a class diagram. If you mix incompatible markup (where e.g. one section indicates a sequence diagram, but the other one indicates a deployment diagram), PlantUML will either give one diagram type the preference, or may throw a syntax error.
At the beginning, I recommend learning PlantUML’s syntax by example. Choose the diagram type you want to build, then take a look at the dozens of examples of the official documentation for the specific diagram type (e.g. activity) that you are working on.
If you are not looking to create any specific kind of diagram, but just want to build a diagram with a few boxes and connecting lines, then I recommend to create a deployment diagram. It comes with several shapes for the boxes, and deployment diagrams also allow for nesting boxes within boxes.
Learning the syntax
As I just said, you should learn the syntax by example for each diagram. You will find that very often there are multiple alternatives for the markup. There is shorter, more concise code, which is less understandable for newcomers, and more verbose alternatives. This is best illustrated by an example, for a use case diagram. The following shows two snippets that produce the exact same diagram:
First, the verbose (but easily understood) snippet:
@startuml
actor "Customer" as customer
actor "Clerk" as clerk
usecase "Perform checkout" as checkout
usecase "Payment" as payment
usecase "Get help" as help

customer - checkout
checkout -[dashed]-> payment : include
checkout -[dashed]-> help : extends
checkout - clerk
@endumlCode language: plaintext (plaintext)
Next, the shorter snippet using shortcuts, less understandable:
@startuml
Customer - (Perform checkout)
(Perform checkout) ..> (Payment) : include
(Perform checkout) ..> (Get help): extends
(Perform checkout) - Clerk
@endumlCode language: plaintext (plaintext)
The rendered output is the same for both snippets:
The first snippet shows the clean way of writing a diagram. The first few lines define elements (of type actor and usecase), the last few lines define the connections between them.
In the second, shorter snippet, understanding the syntax becomes more difficult, because the snippet takes a few shortcuts:
- Use case elements are defined using the
(some text)syntax, i.e., using normal parentheses. The existence of one or more such elements turn the diagram into a use case diagram, implicitly. - Neither the
usecaseelements nor theactorelements are explicitly defined. Whenever you create a connection, and PlantUML does not know the source and target object yet, it creates elements for them automatically. - The elements
CustomerandClerkdon’t need to declare a type (actor), because PlantUML is already in “use case mode” anyway. By default, it assumes that elements without any type declaration areactorelements. - As for the connections, there is a lot of implicit meaning behind the dot and dash characters which define the line type and length. The more characters you define (e.g.
x ....> yvs.x ..> y), the longer the connection will be. As for the line type, there are solid lines (-), dashed lines (.) and dotted lines (~). This is not intuitive at all, you need to learn it by heart. - Elements are not aliased as variables (as it is done by the first example), which is bad practice because it violates the DRY (Don’t Repeat Yourself) principle. If the use case “Perform checkout” were to change to “Checkout”, you would have to update it in all three lines.
I provided this example to prepare you for the fact that these kinds of shortcut notations are very common in the official docs of PlantUML. Expect that you may have to infer the meaning from time to time.
Common diagram elements and comments
PlantUML lets you define a few common elements that are generally useful in any diagram, such as:
- A title shown at the top center of the diagram
- A caption shown at the bottom center
- A header or footer section shown above (or below) all other elements (including title)
- A legend that explains elements or colors of your diagram
Examples are documented on the commons page.
You may also want to write comments into your diagram, which are not rendered. Comments are also useful deactivate statements temporarily. Everything that starts with a simple quotation character (') is a comment. You can also put comments on multiple lines, using /' to start and '/ to end the commented section.
The PlantUML standard library
Similar to other languages, such as C++, PlantUML also comes with a standard library that offers additional functionality, which is not part of the language core. It consists mostly of icons, and corresponding markup constructs which embed these icons into a shape (such as a box). The standard library is baked into PlantUML, so you don’t need to download anything to use it. As the official documentation demonstrates, the standard library consists of several, individual third-party contributions.
Unfortunately, the official documentation page is incomplete. At the time of writing, there are several undocumented libraries, such as C4, logos, or OpenSecurityArchitecture. To find them, open the standard library’s GitHub repository where each library is represented by a sub-folder. You won’t find any documentation in this GitHub repository, though, because the documentation is only found in the original contributor’s repository. To get there, just open the INFO file found in any of the sub-folders (e.g. the one from awslib). The original contributor’s GitHub repository contains the documentation, and for those libraries that contain many icons, they will often include a page that renders a list of all these icons.
Working with images
Including images and icons in a diagram clearly improves its usefulness. PlantUML offers three approaches to do this: sprites, the <img> tag, and OpenIconic icons.
Images as shapes
Everything I describe here refers to putting images into a shape. You cannot use any pixel or vector graphics as shapes themselves (i.e. as shape outlines). See the Deployment diagram documentation for a list of available shapes.
OpenIconic icons
Let’s look at OpenIconic icons first, as they are the easiest ones to use. You simply use a notation such as <&foo> within one of your elements, where foo is one of the icon names as shown on the official docs. These icons scale up and down without loss of quality, using a surrounding <size:XX> tag, e.g. <size:50><&heart></size>.
@startuml
  rectangle "Use an icon: <size:40><&heart></size>"
@endumlCode language: HTML, XML (xml)
The <img> tag
The second approach is to use the <img> tag, which lets you reference existing image or icon files of common formats, such as png, jpg or svg. Use <img:X> where X is either a relative local path, or an absolute URL. To scale the image up or down, use something like <img:X{scale=0.5}> (which would scale the image down to 50%).
Sprites
The last option is to use sprites (documentation). Sprites are monochrome, pixel-based images/icons, i.e., they only have one color, of your choosing. Sprites are typically defined in puml files. The standard library, which I introduced above, comes with a huge list of sprites, which you can include and use in your diagram directly. Using a sprite consists of two steps:
- Locate the path to a sprite and
!includeit:- For sprites that are part of the standard library, use
!includefollowed by a path surrounded by angle brackets (<>), e.g.!include <office/Clouds/cloud_exchange_online.puml> - For all other local or remote
pumlfiles, use!includefollowed by the relative path to the local file, or the HTTP(S) URL. PlantUML also expects that this provided path or URL is not quoted (i.e., do not use surrounding""or<>characters), even if it contains spaces!
- For sprites that are part of the standard library, use
- Use an
!included sprite in one of your diagram elements: use the notation<$name>where, by convention,nameis typically the file name of the includedpumlsprite file, i.e. the last segment of its path (without.pumlextension). For the above example given for the standard library icon, this would e.g. be<$cloud_exchange_online>- You can scale icons up or down the same way you would do it for
<img>tags, e.g.<$cloud_exchange_online{scale=0.5}> - Note that
scale-values larger than1.0will look blurry, because sprites are pixel-based!
- You can scale icons up or down the same way you would do it for
To locate a suitable sprite, I recommend that you familiarize yourself with special purpose and general purpose libraries of the standard library. For instance, the office and tupadr3 (which includes material design and font awesome icons in corresponding sub-folders) are great general purpose libraries, while awslib is a great special purpose library for cloud-related icons. The logos library is also a great source for any kind of product or software library logo.
If you have a specific search term in mind, you can use GitHub’s file search in the standard library root. Open the GitHub repository, press t and enter a search term, e.g. “car” or “user”.
Using local images as sprites
There is a little trick the official documentation does not mention: you can use local image files (in formats such as png, jpg or svg) as sprites, without the need to convert them to pixel-based puml files first. Take a look at the following example:
sprite mySprite my-image.svg
rectangle "<$mysprite>"Code language: plaintext (plaintext)
This lets you use my-image.svg (or any other relative path), which is rendered in full color (not monochromatic). Vector-graphics (such as svg files) retain their quality even if you use scale values larger than 1.0. This is a nice alternative to the <img> tag, because you can define your own icon set with distinct, short names (such as mySprite), rather than using <img> tags with long URLs.
Attention: issues with svg sprites
The mechanism I just presented does not always work without flaws. For svg-based sprites, your rendered image will only look as expected, if you also choose svg as output format.
Also, older versions of PlantUML cannot process svg files that lack a declaration of the width and height attribute at the root node (remember that svg files are actually XML files). You will have to add these attributes manually to be able to use such files as sprites. This has recently been fixed.
Integrating diagrams into your documentation
If you are already using plain text documentation (as introduced in my other article), e.g. with Asciidoc, reST or Markdown, take a look at the PlantUML integration mechanism offered by your tooling. If you use the on-the-fly rendering approach, some platforms such as GitLab even offer a PlantUML integration, such that puml files are rendered to images on-the-fly, too.
If you are using other ways of creating your documentation (e.g. Word, Confluence, etc.), you can always manually save pixel or vector graphics. If you run PlantUML locally, a CLI call such as java -jar plantuml.jar -Tpng diagram.puml will render a diagram.png file for you. Also, web-based editors (such as LiveUML) also offer export buttons.
Conclusion
PlantUML makes it really easy to get started. Just look at the many examples of the official documentation. Use a web-based editor to find out if you like PlantUML’s features, before setting up plug-ins for your local IDE. PlantUML’s Standard library not only offers thousands of icons, but also additional syntax to create custom diagrams, such as C4 model diagrams (using the C4 library). PlantUML has a lot more to offer beyond the basics I presented in this article, which I’m presenting other posts, see here and here.

