Storing documentation as plain text in version control has numerous advantages, such as the ability to understand changes by diffing, or having documentation next to your code. Since documentation contains text and images, this article explains how diagrams can also be written as plain text, which a generator then converts to graphics. I discuss the advantages and disadvantages of this approach, present a list of tools and markup languages, and also discuss how these diagrams can be integrated into your plain text documentation.
Introduction
In the previous article, Plain text documentation in version control, I made my point that documentation can be created as plain text documents in version control, using a markup language such as Asciidoc. The main advantages of this approach are that plain text files can be viewed with any text editor, and can be diffed, just like source code, which helps you understand changes over time.
The same concept can be applied to diagrams. Instead of drawing diagrams in a WYSIWYG editor, you write a few lines (using a mark up language) into a plain text file. A generator converts it into an image file. Consider the following two examples, using Mermaid and PlantUML:


You can play around with such examples interactively, by using a live editor, for PlantUML (see here) or Mermaid (here).
By the end of this article, you will learn that many such mark up languages exist, which let you define all kinds of diagrams, such as UML-like diagrams (class, state, activity, sequence, deployment, use-case, …), business process diagrams, GANTT charts, tree-like diagrams (including mind maps), or UI mockups.
Advantages and disadvantages of plain text diagrams
Let’s start with the advantages:
Of course, there are also disadvantages:
A taxonomy of tools and markup languages
In a nutshell, there are three types of plain text markup languages (with respective generator tools):
- Model-based languages where you define abstract models and concrete views which reference model elements,
- WYSIWYG editors which let you create views (without a backing model) by clicking buttons in a GUI. These editors store the view / diagram in a plain text format such as JSON,
- Markup languages in-between those two extremes, which let you define objects in a model-like way, but also influence view-related aspects.
Models vs. Views
Before we take a closer look at these tools, let’s take a step back and try to understand the terms model and view I used above.
A model describes the individual components of your system (including various attributes) and their relations to other components, using some kind of meta-language as notation. A concrete example would be a class model that models the different (souce-code-level) classes, including their name, description, attributes, and methods.
A view makes a model tangible, by visually expressing it. At this level the software producing the view decides (or lets the user decide) how the graphical representation of the model looks like, to minute detail. For instance, for a class model, it would decide that each class is represented by a box, and relations are drawn as arrows. A view also incorporates all kinds of graphical details, such as the background color of each box or the canvas, the line widths, the coordinate, margin or padding of each box, the font type and size, etc. It often makes sense to create multiple views for a specific model, where each view illustrates different aspects, answering a specific question about the model.
Tool taxonomy re-visited
Let’s now re-examine the three types of markup languages I introduced above:
- Model languages like Structurizr DSL let you define both the model and a set of views. The definition of a view includes the type of the diagram (e.g. class diagram), references to a set of model elements to be included into the diagram, and further configuration parameters (e.g. affecting the layout, colors, etc.). The corresponding generator tool will then render the diagrams for you, and compute a best-efforts layout of all its elements.
- WYSIWYG editors exist which store diagrams in plain-text formats (rather than binary files), e.g. yEd which stores
Graphmlfiles, or Excalidraw which createsJSONfiles. Their data format (their internal “model”) starts on the view level right away. It lacks meaning regarding what the lines, boxes and other elements really mean – they are just boxes and lines. There is no underlying model. The produced plain text files are rather verbose and long, because they include presentation aspects, e.g. whether a box uses rounded corners, object coordinates, or line widths. - In the middle of the spectrum there are markup languages like Mermaid or PlantUML. They let you define a little bit of both model and view-related aspects. Typically, these tools do layouting for you, but offer means to influence the layout. This is done using constraints, rather than letting you assign specific coordinates to elements. These kinds of markup languages work just like textual markup languages (e.g. Asciidoc or Markdown), which I presented in the Plain text documentation article. They define a syntax for each diagram element, including generic elements like boxes and connections, but also domain-specific elements like an UML class. Consequently, you are still building views, but on a semantic level, using the concise markup language.
Advantages and disadvantages
As you can imagine, each approach has a few problems.
WYSIWYG editors have two issues. The first one is inconsistency of elements whose details diverge in different views. Let’s understand that by looking at an example. Suppose you first build diagram #1 for your model, e.g. a class diagram. Next, you create diagram #2, e.g. a sequence diagram. You copy and paste certain elements from diagram #1 to #2 to save time. At some point, you change an element (e.g. the name of a class) present in both diagrams only in one of the diagrams. You end up with inconsistent views. The second issue with WYSIWYG editors is that diffing of the produced plain text files in version control is difficult, because these produced files are huge, and even small changes (e.g. changing the position of an element) can produce a massive, incomprehensible diff.
The core issue of model-based tools is that they are very domain-specific. For instance, Structurizr DSL is specific to the C4 model to document software architectures. Also, the generated diagrams are built using automatic layout algorithms, where a high-level model markup language might not have bothered with providing syntax that lets you fix layout issues manually. As a consequence, the objects in generated diagrams can be illogically arranged, and there’s nothing you can do about it.
The core issue of markup languages, such as PlantUML or Mermaid, is that they you can still end up with inconsistent views, as I described it above for WYSIWYG editors. To work around the problem a bit, there are mechanisms such as an include <file> command. This lets one diagram include another one, re-using all (or a selected sub-set) of its elements. Still, the files are just diagrams, not models. For instance, you cannot define a PlantUML class object in file #1, then define a PlantUML sequence diagram in file #2 (which #includes the class from file #1), because PlantUML will still render the class as a class box (including its attributes) and turn the sequence diagram into a class diagram. The following table summarizes the pros and cons:
| Consistent views | Easy to diff | Independent of specific domain | Full layout control | |
| WYSIWYG editor | ❌ | ❌ | ✅ | ✅ |
| Model-based tool | ✅ | ✅ | ❌ | ❌ |
| Markup language | 😐 Partially, using #include (only some markup languages) | ✅ | ✅ | ❌ |
Tool selection
Existing generator tools and markup languages can be divided into generic and special-purpose tools, where the latter serve a single, specific domain. Let’s take a look at generic tools first:
| Description | |
| PlantUML | Markup language that supports both generic “box and lines” diagrams, and many domains, e.g. UML (class, sequence, …), wire frame UI mock-ups, Gantt charts, mind maps, and more. I present a more thorough introduction to PlantUML in this article. |
| Mermaid | JavaScript-based in-browser rendering engine whose markup language supports certain UML diagrams (class, sequence, activity, state machine), but also generic diagrams such as pie-, flow- or Gantt charts. The customization capabilities are fewer than those of PlantUML, and a Mermaid file cannot #include other Mermaid files. |
| pikchr | A markup language for generic box/circle/line diagrams. To me, pikchr’s syntax is much less intuitive than the one of Mermaid or PlantUML, despite the author’s attempt to make reading pikchr code feel almost like reading natural language. |
Next, here is a list of special-purpose tools:
| Description | |
| Structurizr DSL | A textual, domain-specific language (DSL) to create software architecture models and related views based on the C4 model. The corresponding (meta-) generator converts the document to an intermediate format such as PlantUML or Mermaid. |
| erd | Entity Relationship (ER) diagrams |
| Msc | Message sequence diagrams |
| nomnoml | UML-like class, activity and use-case diagrams |
| state-machine-cat | State machine diagrams |
| Syntrax | Railroad diagrams, as known from visual (SQL) grammar explanation diagrams |
| wavedrom | Digital timing diagrams |
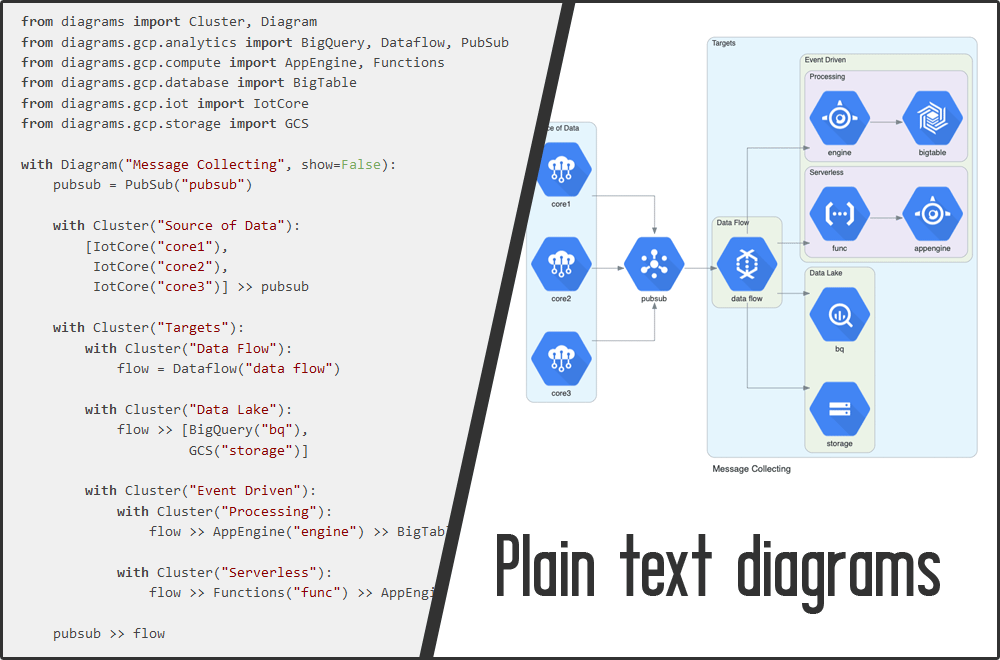
| diagrams | Cloud system architecture diagrams, defined in Python |
| Vega, Gnuplot, etc. | Let you define plots (based on some N-dimensional data) without having to know a programming language, e.g. bar or line chart, scatter plot, etc. There are also many programming-language-specific libraries, e.g. matplotlib for Python. |
Of course, further tools exist, see e.g. here for a list.
Integrating plain text diagrams into documentation
Using plain text documentation with, say, Markdown, Asciidoc or reStructuredText, you will want the ability to embed plain text diagrams with little effort. There are two approaches how to do that, which depend on your chosen rendering approach (see Plain text documentation in version control article) for the generation of your documentation:
- If you chose the CI generation approach, you can build a CI pipeline that first converts the diagram files (e.g. your
.pumlPlantUML file) to an image file (e.g. SVG or PNG), which is then referenced by your documentation files. - Alternatively, check whether your selected markup language integrates with your chosen diagram language. Such an integration mechanism is either inline (such that your documentation file also contains diagram markup), or by
#includinga diagram file, referencing its path. The documentation generator then takes care of converting the diagram files to images as part of the documentation rendering process.- For Asciidoctor, see here for the list of supported diagram types.
- For Markdown, the support depends on the Markdown renderer used by your static page generator. For instance, Docsify has plugins which add support for integrating with PlantUML, Mermaid or WebSequenceDiagrams. There is one caveat, though: these integrations typically convert the
pumlfile content to a large query string and send it to a PlantUML-server for live rendering. This usually works fine, but it won’t work for diagrams with local!import(include) statements, because these files are not known to the server! - Spinx (reStructured Text) also offers various plugins for this purpose, just do an Internet search, e.g. for “sphinx plantuml”.
Collaborative diagram editing
While creating diagrams on your own works, you will typically achieve the best results in a collaborative workshop. When working on a real whiteboard or flip chart is not feasible (hello COVID-19), people often use WYSIWYG editors which support real-time collaborative editing, such as Excalidraw or diagrams.net (draw.io).
When you switch from such WYSIWYG editors to plain text diagrams, real-time collaboration is still an option. In my collaborative code editors article I presented several solutions that let you write code collaboratively in real time. And guess what: plain text diagrams are like code! The whole idea of plain text diagrams is also often referred to as “diagrams as code”. People using this term don’t mean “code” literally (in the sense of “code of a programming language”), but in the sense of “diagrams as text files in a code repository”.
Exemplary, you can collaboratively work on a PlantUML diagram, if you and your peer both use VS Code (with the Microsoft Live Share and PlantUML live renderer plug-ins) or an IntelliJ-based IDE (with a collaborative plug-in, such as Code With Me or CodeTogether).
Conclusion
Any comprehensive documentation should include diagrams, because images often help convey ideas and concepts more effectively than text. This article made a strong case for using plain text diagrams which are rendered to a images, rather than drawing them with an editor and saving them as immutable, hard-to-compare pixel or vector graphics.
As always, the right tool depends on the context and your objective. Traditional diagramming tools, like Visio, are not always a bad choice. For instance, if you are at the beginning of a project and just need to draw a few throw-away sketches to get a first idea of your system, then a digitized whiteboard tool (such as Visio or Excalidraw) are a good fit. But once your views become more stable (and/or larger) and you need traceability on how they evolve (think: diffing), plain text diagrams, built with model-based tools or markup languages, will serve your needs better.